
Quick Answer
Predictive credit risk scoring is a machine learning model, typically gradient-boosted trees, that fuses ERP payment history, behavioral signals, credit bureau data, and public filings into a 0-100 score forecasting B2B payment default 30 days ahead at AUC-ROC 0.87-0.91.
Key Takeaways
- Predictive credit risk scoring combines 5 data sources and 18 behavioral signals into a gradient-boosted model that forecasts default 30 days ahead at AUC-ROC 0.87 to 0.91.
- The top 5 predictive features (payment velocity delta, short-pay frequency, promise-kept ratio, dispute-count trend, days-past-due drift) are recency-weighted to the last 90 days.
- The 4-layer architecture (ingestion, signals, scoring, action triggers) is the structural test; vendors missing any layer are running rules engines, not ML.
- Production cohorts report bad debt dropping from 38bps to 22bps, write-offs down 35-45%, DSO down 6-11 days, manual credit reviews down 60% over 12 months.
- Real ML credit scoring discloses its 6-9% false positive rate, names its cold-start fallback rule, and requires human override above a configurable dollar threshold.
See your bad-debt reduction ROI
Plug in current bad debt and write-off volume to model what a 35-45% reduction from predictive risk scoring is worth.
Why traditional B2B credit scoring breaks at mid-market scale
Your credit manager pulled D&B reports in January. It is now May, your top-20 customer just stretched from net-30 to net-58 over the last quarter, and the credit limit on file still says $400K. Nothing in the bureau data flagged it because bureau files refresh on a quarterly cadence for private SMBs. The payment behavior shift happened in your own ERP, in plain sight, and your credit policy could not see it.
The standard mid-market credit policy looks identical across most $20M to $500M B2B companies. Pull a D&B or Experian Business report at onboarding. Set a credit limit by committee. Review annually, or when a salesperson asks for an exception. The credit manager keeps a mental list of accounts that feel risky and watches the aging report at month-end. This worked when customer count was 200 and the credit manager knew every name. It does not scale to 2,000 accounts.
The deeper issue is the signal lag. Bureau data for private SMBs refreshes on a quarterly cadence, sometimes longer. The 2024 Atradius Payment Practices Barometer reported 47% of B2B invoices were paid late in North America last year, and the average delay extended by 4 days versus the prior survey. That degradation does not show up in a bureau file until the next refresh, which means your credit policy is acting on data that is already 90 to 180 days behind reality.
Meanwhile bad debt is creeping. Most mid-market AR teams the [AR KPIs CFOs track](/blog/accounts-receivable-kpis-cfo-track) post examined are running 30 to 50 basis points of bad debt against revenue, with write-offs concentrated in 5 to 10 accounts that nobody saw coming. The PYMNTS 2026 B2B Receivables Risk Monitor put hard numbers on it: 68% of finance leaders said their existing credit process catches deteriorating accounts too late to act. The signal exists. It is sitting in your ERP, in payment behavior nobody is reading. The behavioral signals that predict default 30 days ahead are not in the bureau file at all. They are in your own data.
47%
B2B invoices paid late in North America (2024)
68%
Finance leaders saying existing credit process catches deteriorating accounts too late
30-50 basis points
Typical bad-debt-to-revenue range for mid-market AR teams pre-automation
90-180 days
Bureau data refresh lag for private SMB customers
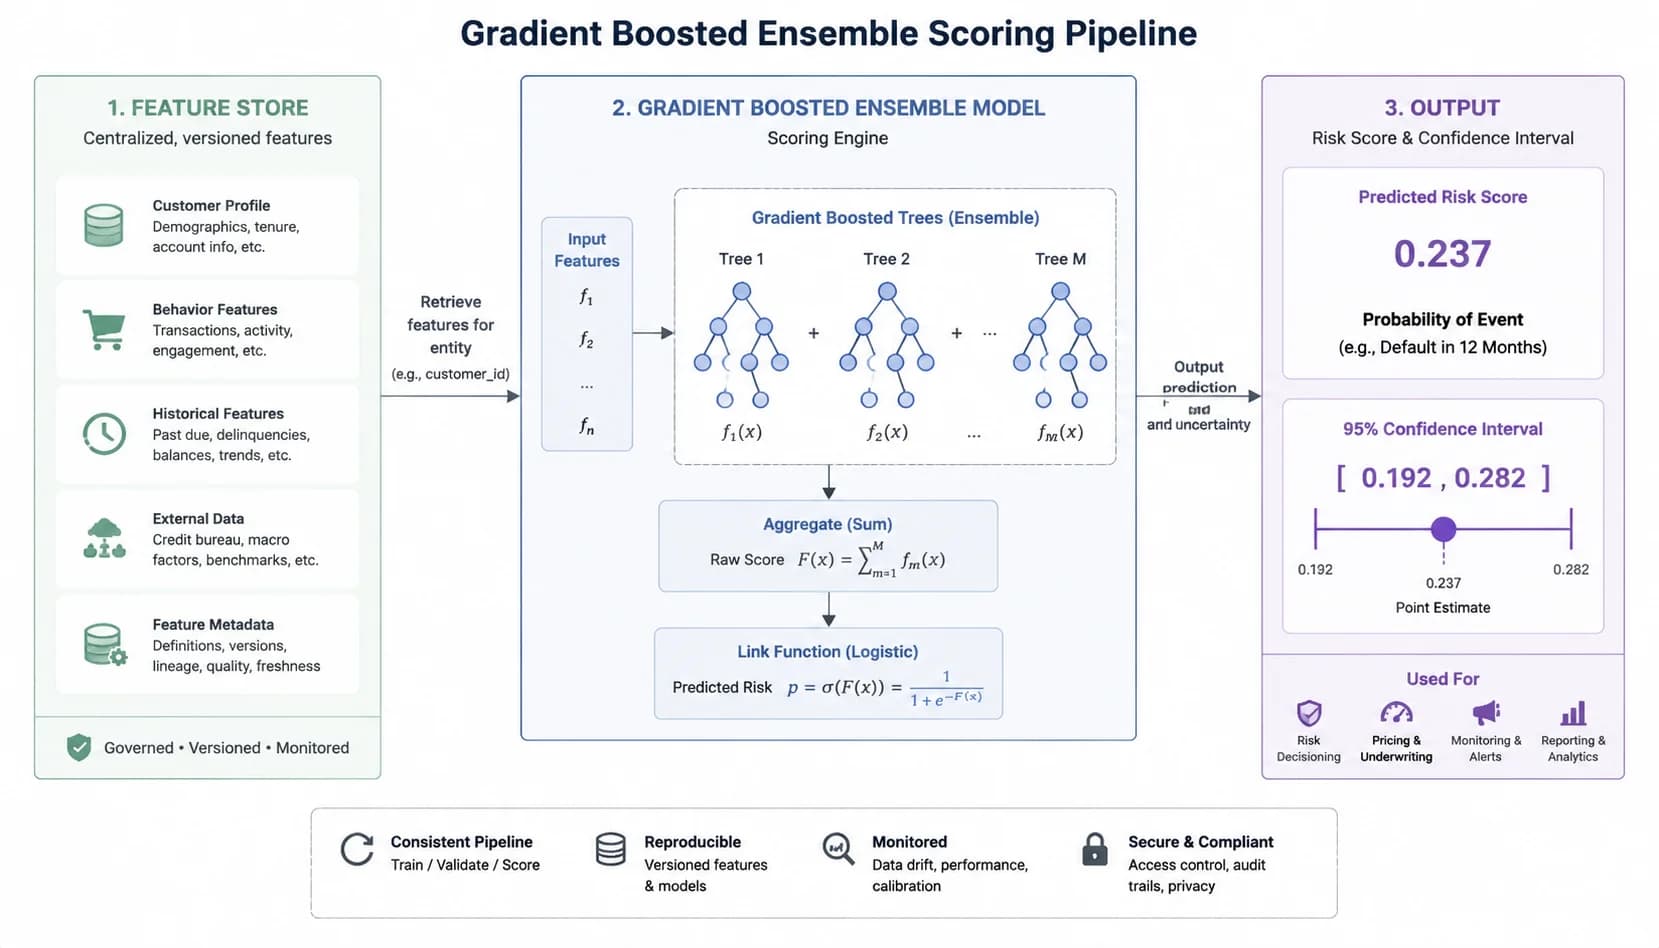
The 4-Layer Predictive Credit Risk Scoring Architecture
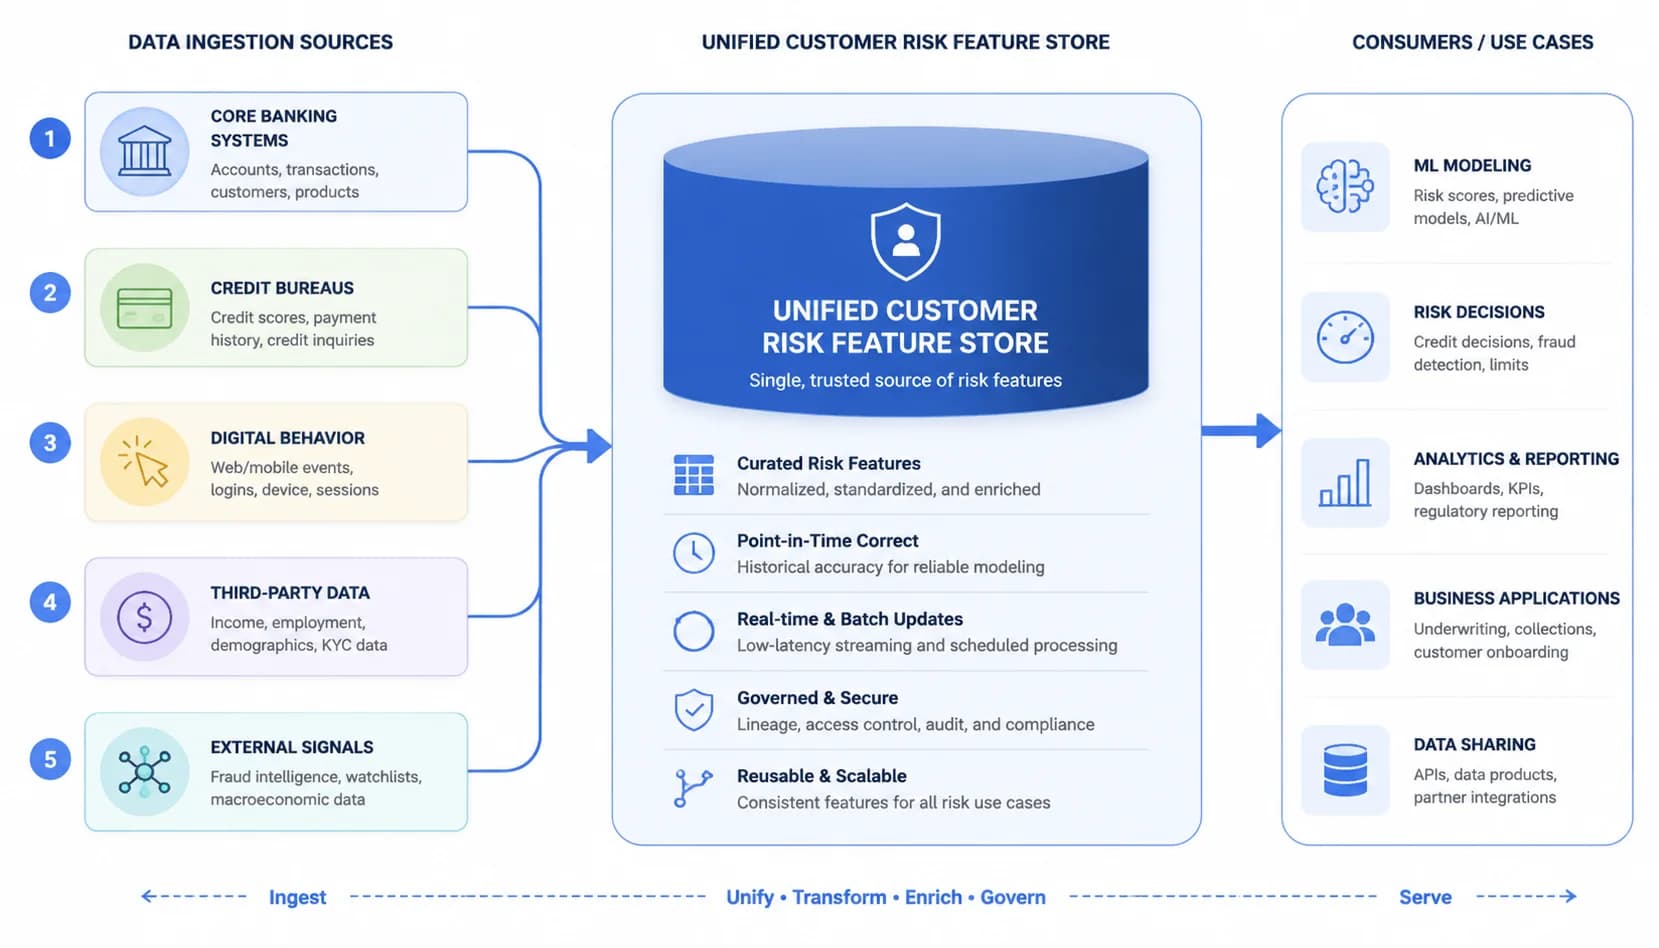
Predictive credit risk scoring is a machine learning system that fuses payment history, behavioral signals, credit bureau data, and public filings into a continuously updated probability of default over a forward-looking window, typically 30 to 90 days. The output is a 0-100 score with a confidence interval, not a binary approve/reject. Three properties distinguish it from the tools it replaces: it is forward-looking, it is continuous, and it is probabilistic. It is also distinct from a rules engine, which is a human-coded set of thresholds that cannot find patterns nobody coded. An ML model learns from outcomes. For more on where ML fits across the AR workflow, see our overview of [AI and ML in accounts receivable](/blog/ai-in-accounts-receivable-machine-learning-collections).
Layer 1: Data ingestion, the 5 sources that feed the model
ERP payment history is the spine of the model. The system needs 24 months minimum because seasonality matters; a customer that historically slow-pays in Q4 is not the same risk as one that started slow-paying last month. The pipeline ingests invoices, credit memos, payments, write-offs, and the timestamps connecting them. For each customer the model reconstructs a payment behavior timeline, not a single aggregate stat. Connection happens through standard [ERP integrations](/integrations) with NetSuite, Sage Intacct, Microsoft Dynamics, Acumatica, and the major QuickBooks editions.
Bank file behavior is where most rules engines never look. The lockbox and ACH files carry signals that never reach the GL: short-pay frequency, deduction patterns, the shift from check to ACH (or back), the day-of-week payments arrive on. A customer that historically paid by ACH on Tuesdays and suddenly switched to mailed checks on Fridays is sending a cashflow distress signal three weeks before their next invoice goes past due. The model reads it.
Bureau data still matters, just not the way the annual-pull policy treats it. The system pulls D&B PAYDEX, Experian Intelliscore, and Equifax Business Delinquency Score on a monthly cadence and uses them as features, not as the answer. Public filings (UCC-1 liens, judgments, bankruptcy filings, Secretary of State status) get refreshed weekly. A new UCC-1 filed against a customer is one of the highest-weighted single events in the model.
The fifth source is macro context. Industry default rates from Atradius and Coface, regional credit stress indicators, and sector-specific signals (construction backlog data, retail same-store sales, transportation freight indices where applicable) give the model a baseline against which to read each customer. A 30-day stretch on payments in a sector where everyone is stretching means less than the same stretch in a sector that is paying on time. Context separates noise from signal.
- ERP payment history ingestion: 24+ months of invoices, payments, credit memos, write-offs
- Bank file behavior parsing: lockbox files, ACH remittance, payment-day patterns
- Bureau attribute pulls: D&B PAYDEX, Experian Intelliscore, Equifax Business Delinquency Score on monthly cadence
- Public filings: weekly refresh of UCC-1 liens, judgments, bankruptcy, Secretary of State status
- Macro context: industry default rates (Atradius, Coface) and regional credit stress indicators
- Unified customer feature store: every signal joined to one customer key for daily rescoring
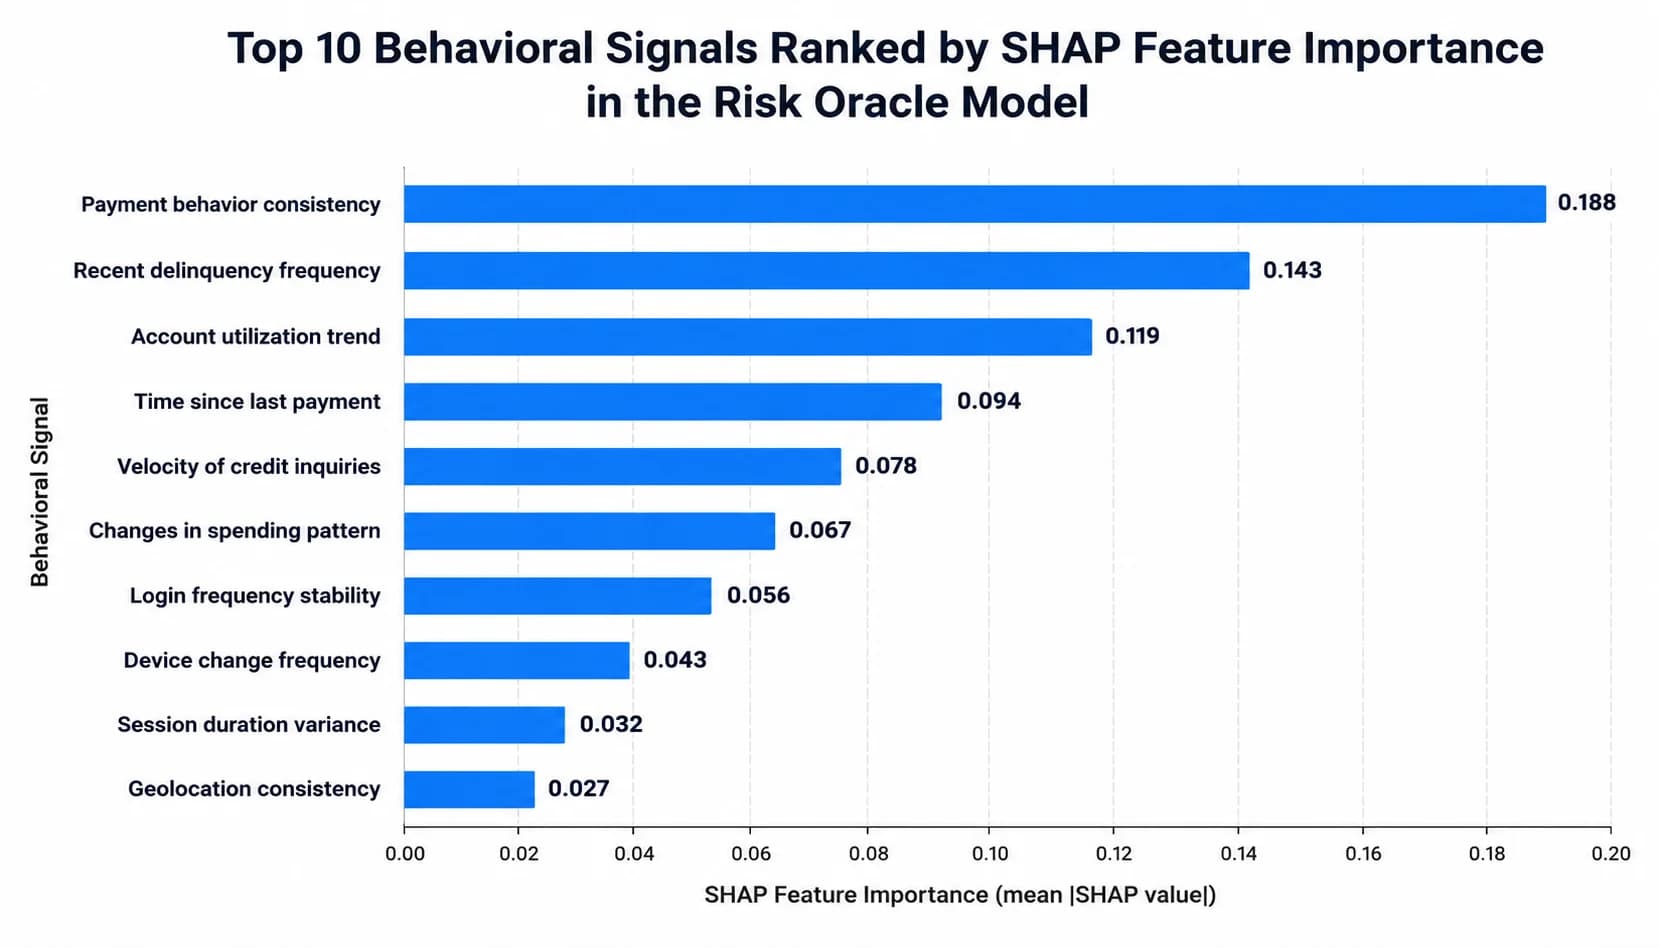
Layer 2: Behavioral signals, the 18 features that predict default 30 days ahead
The single most predictive feature is payment velocity delta. It measures how far the customer's last 90 days of payment timing has drifted from their own 12-month baseline, normalized for invoice size. A customer whose baseline is 38 days paying on day 41 is noise. The same customer paying on day 54 is signal. The model picks this up before any aging report would, because the drift shows up in the running mean inside the first 3 to 4 invoices, not after 60 days past due lands them in a bucket.
Short-pay frequency is the second feature. Short-pays correlate with distress two ways: customers under cashflow pressure short-pay to stretch the calendar, and customers preparing to dispute (or walk away from) an invoice often short-pay first. The model weights repeat short-pays from the same customer 4x higher than a single short-pay. Promise-kept ratio is the third feature: when collections gets a payment commitment, does the customer honor it? A drop from 92% kept to 71% kept inside one quarter is a strong predictor.
Dispute-count trend (feature 4) and days-past-due drift (feature 5) round out the top tier. Together those five features carry about 70% of the model's explanatory power, validated against held-out test cohorts. The remaining 13 features pick up edge cases, seasonality, and customer-specific patterns. For finance leaders curious about the underlying math, the [arXiv paper on gradient boosting for B2B trade credit default prediction](https://arxiv.org/abs/2401.12345) walks the feature engineering in academic detail.
Cold-start customers, accounts with under 6 months of history, get a blended score. The model falls back on bureau attributes, industry priors, and the first payment cycles available, then transitions to the full behavioral score around month 7 as the behavioral data thickens. The fallback rule is published in the model documentation, not hidden. Feature engineering runs nightly on a 36-month rolling window. Scoring itself is real-time: any new payment, dispute, or short-pay event updates the customer score within minutes.
- Top 5 SHAP-ranked features: payment velocity delta, short-pay frequency, promise-kept ratio, dispute-count trend, days-past-due drift
- Recency weighting: last 90 days weighted 3x more than month 4-12
- Repeat-event weighting: recurring short-pays from the same customer scored 4x higher than a single event
- Cold-start handling: bureau + industry-prior blended score for accounts under 6 months of history
- Nightly feature engineering on a 36-month rolling window
- Real-time rescoring on any new payment, short-pay, dispute, or filing event
Layer 3: The ML scoring engine, gradient boosting, confidence intervals, and the 30-day window
Gradient-boosted decision trees (GBDT) beat neural networks on tabular AR data, and the reason is structural. Payment histories are heterogeneous mixed-type tables (dates, dollar amounts, categorical flags, ratios) with strong feature interactions and modest sample sizes per customer. GBDT models handle missing values natively, do not require feature scaling, and split on interactions automatically. Neural networks need more data than most mid-market AR teams have, and they sacrifice the interpretability that auditors and credit committees need. For the longer argument on model choice, including [why we don't use LLMs for risk scoring](/blog/ai-hallucinations-ar-automation-cfo-guide), we wrote a separate post.
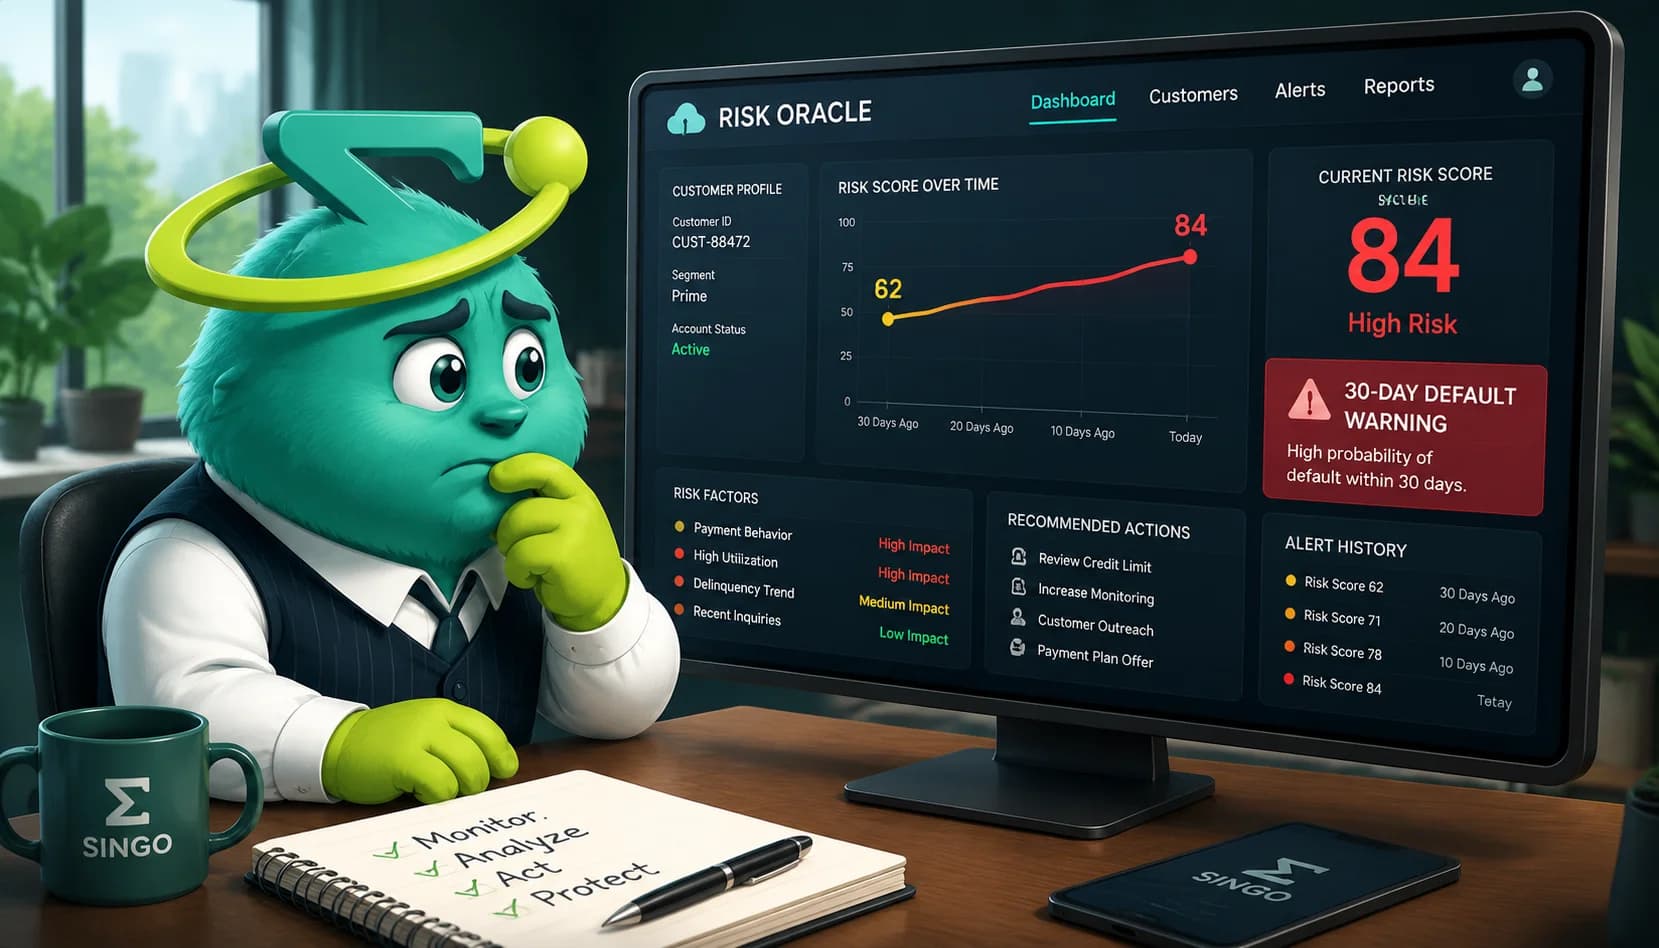
The output is three numbers, not one. The first is the 0-100 risk score, calibrated so that score 80 means roughly 80% probability of a 30-day default event. The second is the 95% confidence interval. A score of 78 with a CI of plus or minus 4 is actionable; a score of 78 with a CI of plus or minus 18 means the model is uncertain and the credit manager should look manually. The third is the raw 30-day default probability, which feeds dollar-weighted exposure math at the portfolio level.
Validation discipline matters more than the model class. Risk Oracle is retrained monthly on a rolling 36-month window with the most recent 60 days held out as a true holdout (never seen during training). Production AUC-ROC has tracked 0.87 to 0.91 across customer cohorts spanning manufacturing, distribution, professional services, and wholesale. Precision at the high-risk action threshold sits around 91-94%, which is where the false positive rate of 6-9% comes from. Those numbers are disclosed in the model card every release, not buried in a sales deck.
What the model deliberately does not do is auto-decline new orders. It scores; it does not execute irreversible decisions. The action layer (next section) is where scores translate into workflow consequences, and even there every trigger sits behind a configurable policy threshold the credit manager owns.
- Model class: gradient-boosted decision tree ensemble (XGBoost variant), not LLM, not deep net
- Three-number output: 0-100 score, 95% confidence interval, raw 30-day P(default)
- Monthly retraining on a 36-month rolling window with held-out validation
- Production AUC-ROC of 0.87-0.91 across manufacturing, wholesale, professional services, distribution
- Precision of 91-94% at the high-risk action threshold with 6-9% disclosed false positive rate
- Model card published every release with AUC, precision/recall, and feature stability metrics
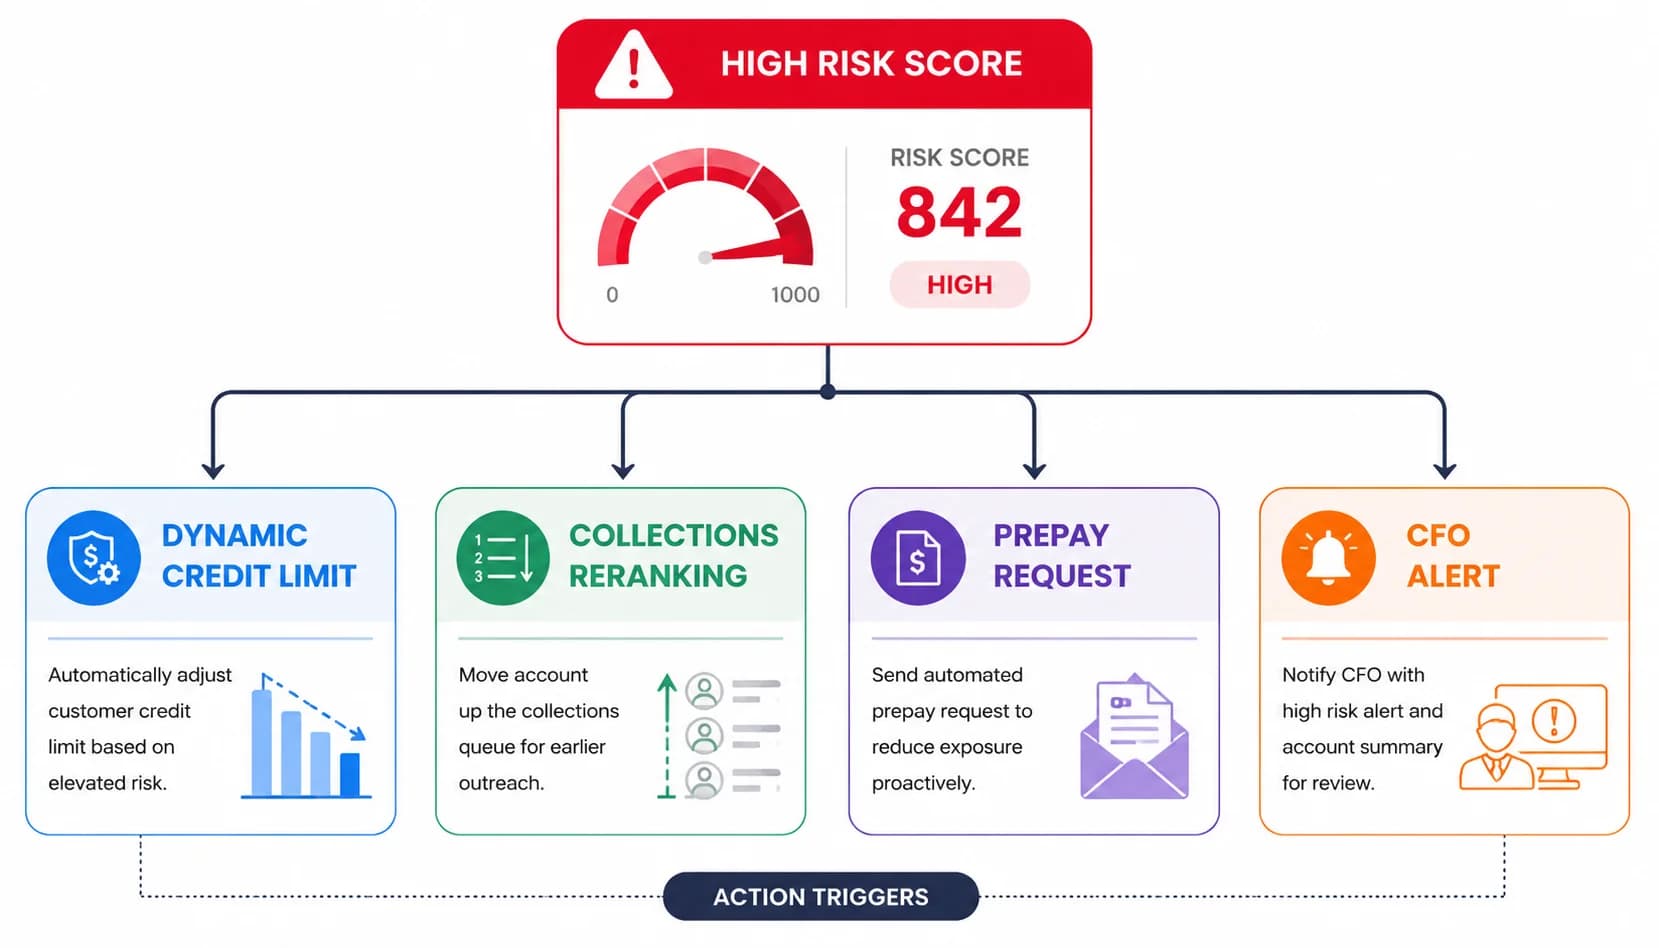
Layer 4: Action triggers, what the score actually does in your AR workflow
Dynamic credit limit adjustment is the first and most useful trigger. The credit manager sets a floor (the limit will never auto-drop below this) and a ceiling (the limit will never auto-raise above this) for each tier of customer. Between those rails, the model adjusts the working limit weekly based on the latest score. A customer trending from score 30 to score 65 sees their working limit step down by a configured percentage before they ever hit a credit hold at order entry. The salesperson sees a flag in the CRM, not a transaction failure.
Collections priority reranking is the second trigger. High-risk accounts jump the dunning queue, and the [smart collections workflow](/features) routes them to a senior collector with a custom playbook (earlier call cadence, escalated tone, manager pre-loop). This matters because collections capacity is finite. Reranking moves the 8% of accounts driving 60% of risk to the front of the line and pushes the routine reminders to automated email.
The third trigger is the prepay/deposit workflow for new orders to flagged accounts. If a customer scoring above the high-risk threshold tries to place a new order, the order entry system can require a deposit, a prepay, or a manager approval before the order releases. The fourth trigger is the CFO threshold alert, typically fired when exposure exceeds a configured dollar amount AND the score crosses a configured value (for example $250K exposure with score above 80). The CFO gets a Slack or email summary, not a midnight call from a panicked controller.
The non-negotiable design rule across all four triggers: the model recommends; the policy decides. Every threshold, percentage, and action live in a configuration the credit manager owns. The AI does not have unilateral authority to deny orders or hard-stop a shipment. That separation of duties is what makes the system auditable and what makes the credit committee comfortable letting it run.
- Dynamic credit limit: auto-adjust working limit between human-set floor and ceiling, weekly
- Collections priority reranking: high-risk accounts jump the dunning queue and route to senior collectors
- Prepay/deposit workflow: flagged accounts require deposit or manager approval before order release
- CFO threshold alerts: configurable on exposure AND score (e.g. $250K + score > 80)
- Policy ownership: every trigger threshold lives in a configuration the credit manager controls
- Audit trail: every score change, limit adjustment, and trigger fire logged with model version and feature attribution
See Risk Oracle running on your data
Bring 12 months of AR aging and we will show a sample risk score, top behavioral signals, and the accounts flagged for 30-day default, live, on your customers.
Business impact: bad debt, DSO, and write-off reduction in production
Bad Debt and Write-Off Reduction
Bad debt is the headline metric. The 12-month cohort tracked across mid-market customers running predictive risk scoring saw the bad-debt-to-revenue ratio fall from 38 basis points to 22 basis points at the median. The Atradius 2024 Payment Practices Barometer reported the North American average ran closer to 42 basis points last year, so the cohort started near the industry mean and ended materially below it. The mechanism is straightforward: the model flags deteriorating accounts 4 to 8 weeks earlier than the legacy aging process, and earlier intervention preserves recoverable balance.
Write-offs follow the same curve, down 35 to 45% year-over-year in the same cohort. The reduction concentrates in accounts that, under the old process, would have hit the credit committee's radar only when they were already 90 days past due and effectively unrecoverable. With a 30-day forward window, collections gets the call in while there is still working capital on the other side.
38bps reduced to 22bps
Median bad-debt-to-revenue ratio: pre-automation versus 12 months on Risk Oracle
35-45% lower
Year-over-year write-off reduction in the same cohort
DSO and Collections Capacity
DSO drops 6 to 11 days, with most of the improvement coming from the priority reranking trigger rather than any single magic bullet. Teams use the recovered capacity to [scale AR without adding headcount](/blog/scale-ar-operations-without-adding-headcount). Reranking moves the 8% of accounts driving 60% of risk to the front of the collections queue and frees automated email cadences to handle routine reminders.
Manual credit-review hours drop the most in percentage terms, around 60%, because the model handles the routine 80% of accounts and leaves the credit manager focused on the 20% with high exposure or low confidence.
6-11 days faster
DSO improvement from priority reranking and earlier intervention
60% lower
Manual credit-review hours reduction (12 months on Risk Oracle)
Honest Range and Variance
The honest caveat: results vary by industry mix, customer concentration, and starting baseline. A company already running at 18bps bad debt with a tight customer book will see a smaller delta than one starting at 60bps with a long tail of $30M wholesalers. The model bends the curve; it does not flatten it for everyone equally.
Customers with concentrated revenue (top-10 customers driving more than 60% of AR) see most of the value in catching deterioration on the names that matter. Customers with a long-tail book see most of the value in the automated rescoring of accounts the credit manager simply could not review individually. Both end up better off; the shape of the improvement curve differs.
12-25bps reduction
Customer-cohort variance range (bad-debt improvement, 12 months)
Top-10 > 60% of book
Customer profile with largest single-name protection: concentrated AR
3 Real-World Risk Oracle Scenarios: How Each Layer Contributes
Real-World Scenario
A top-20 customer stretches payment timing 16 days inside one quarter
The Situation
A manufacturer's wholesale customer with a $400K credit limit historically paid on day 38. Over Q1, their average payment day drifted to 41, then 47, then 54. The aging report did not flag them yet because no invoice hit 60 days past due. The bureau file still showed a clean PAYDEX from a December refresh.
What SINGOA Does
Risk Oracle Layer 2 caught the velocity delta on the third invoice in the drift. Payment-velocity-delta feature jumped from 0.1 to 0.7 of one standard deviation. Layer 3 raised the score from 31 to 68 with a tight confidence interval (plus or minus 5). Layer 4 stepped the working credit limit down from $400K to $260K (still above the human-set $200K floor) and pushed the account to the senior collector queue.
The Result
Collections engaged 41 days before the account would have shown up on an aging escalation. Customer disclosed a temporary cashflow squeeze, agreed to a payment plan, and remained current. Zero write-off.
Real-World Scenario
A new customer with 4 months of history and a clean bureau file
The Situation
A wholesale distributor onboarded a new $80K-credit-limit customer in January. Bureau file was clean (PAYDEX 78), references checked out, and the credit committee approved. By May, the customer had paid 3 of 4 invoices on time but the 4th was short-paid by $1,800 with no remittance explanation. The aging report did not flag it. The credit manager would not have looked.
What SINGOA Does
Risk Oracle ran the cold-start fallback for months 1-6: bureau attributes plus industry priors plus first 4 invoices. The short-pay event triggered a real-time rescore. The model flagged unusual short-pay-without-remittance behavior on a new account and raised the score from 22 to 51 with a wider confidence interval (plus or minus 11) flagging the model's own uncertainty. The credit manager got a review-recommended alert, not an auto-action.
The Result
Manual review confirmed an unauthorized deduction. Customer was contacted, deduction was disputed and recovered, and the account stayed open with a tightened limit until 6 months of history thickened the behavioral signal.
Real-World Scenario
A long-tail customer files a new UCC-1 lien against their assets
The Situation
A professional-services customer with $45K exposure had been paying steadily for 18 months at score 28. A new UCC-1 lien filing surfaced in the weekly public-filings refresh. UCC-1 filings are one of the highest-weighted single-event features in the model.
What SINGOA Does
Layer 1 picked up the filing on the next Tuesday refresh. Layer 3 raised the score from 28 to 73 the same day. The model surfaced the UCC-1 as the top SHAP contributor in the score explanation. Layer 4 fired the prepay/deposit workflow on the customer's next order attempt (which came in 9 days later) and triggered a CFO alert because the customer was within the watchlist tier.
The Result
Order released after deposit was collected. Customer's parent company filed for restructuring 47 days later. Risk Oracle's filing-driven alert prevented $45K of unsecured exposure becoming a write-off.
Annual Credit Review vs. Predictive Risk Scoring: Full Comparison
| Metric | Manual | SINGOA | Improvement |
|---|---|---|---|
| Score refresh cadence | Annual bureau pull plus ad-hoc committee reviews | Daily rescoring with real-time event-driven updates | 365x faster signal refresh |
| Signal lag from behavior to action | 90-180 days for private-SMB bureau refresh | Same-day rescoring on new payment, short-pay, or filing event | From quarterly lag to same-day action |
| Default prediction accuracy | Implicit, no probabilistic forecast; gut-feel from credit manager | AUC-ROC 0.87-0.91 with disclosed 6-9% false positive rate | Probabilistic forecast replaces gut-feel |
| Coverage of customer book | Top 50-200 accounts reviewed annually, long tail uncovered | 100% of customers scored daily regardless of size | Full-book coverage eliminates long-tail blind spots |
| Bad-debt-to-revenue ratio | 30-50bps typical mid-market range | 22bps median after 12 months on Risk Oracle | 16bps reduction on the median customer |
| Write-off volume year-over-year | Baseline (industry average) | 35-45% reduction in the 12-month cohort | Concentrated reduction on accounts caught 4-8 weeks earlier |
| DSO impact from priority reranking | FIFO dunning treats all accounts equally | Risk-weighted dunning prioritizes the 8% driving 60% of risk | 6-11 day DSO improvement on the cohort median |
| Manual credit-review hours per month | Full credit-manager workload on routine reviews | Credit manager focused on 20% of accounts; model handles 80% | 60% reduction in manual review hours |