
Quick Answer
A customer payment portal is a secure online destination where B2B buyers view invoices and pay through multiple methods. Industry-average adoption sits at 20-30%; top performers reach 81%. Hitting 85% requires three stacked layers: white-label branding, frictionless UX, and embedded pay-now distribution.
Key Takeaways
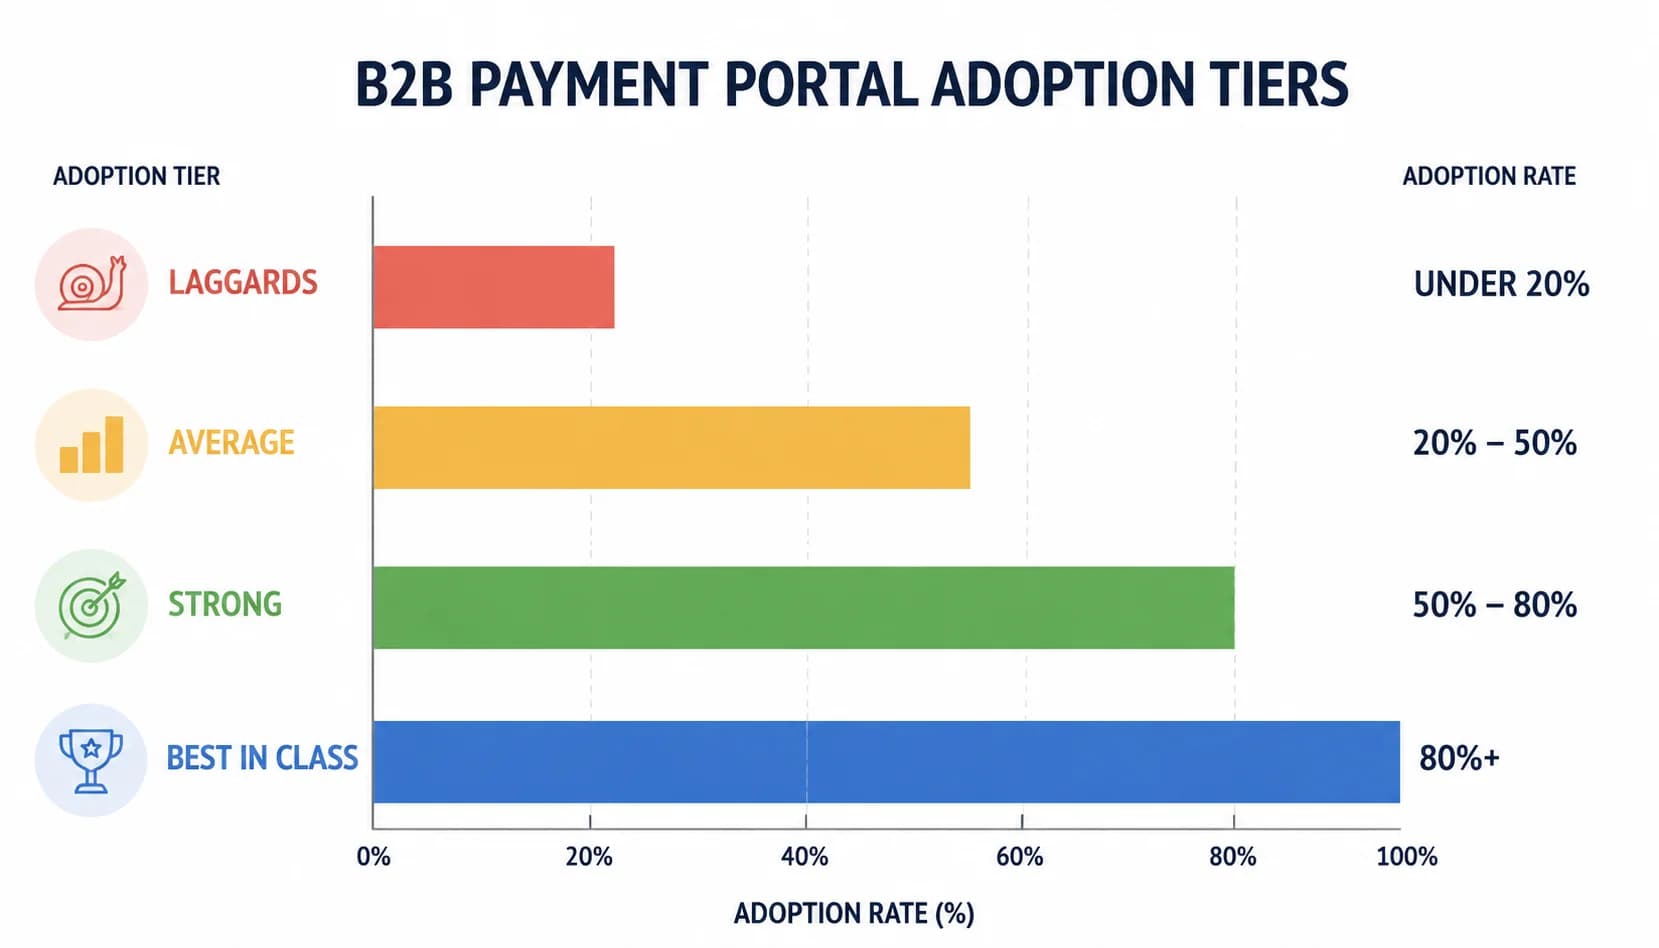
- Industry-average B2B payment portal adoption is 20-30%; top performers reach 81%, and 85% is the achievable best-in-class target for mid-market AR teams.
- Three stacked layers drive 85% adoption: white-label branding for trust, frictionless UX with no-login pay links, and pay-now buttons embedded in every channel.
- A vendor-branded subdomain alone caps adoption 10-15 points below a true white-label equivalent because B2B buyers will not enter banking details on a mismatched domain.
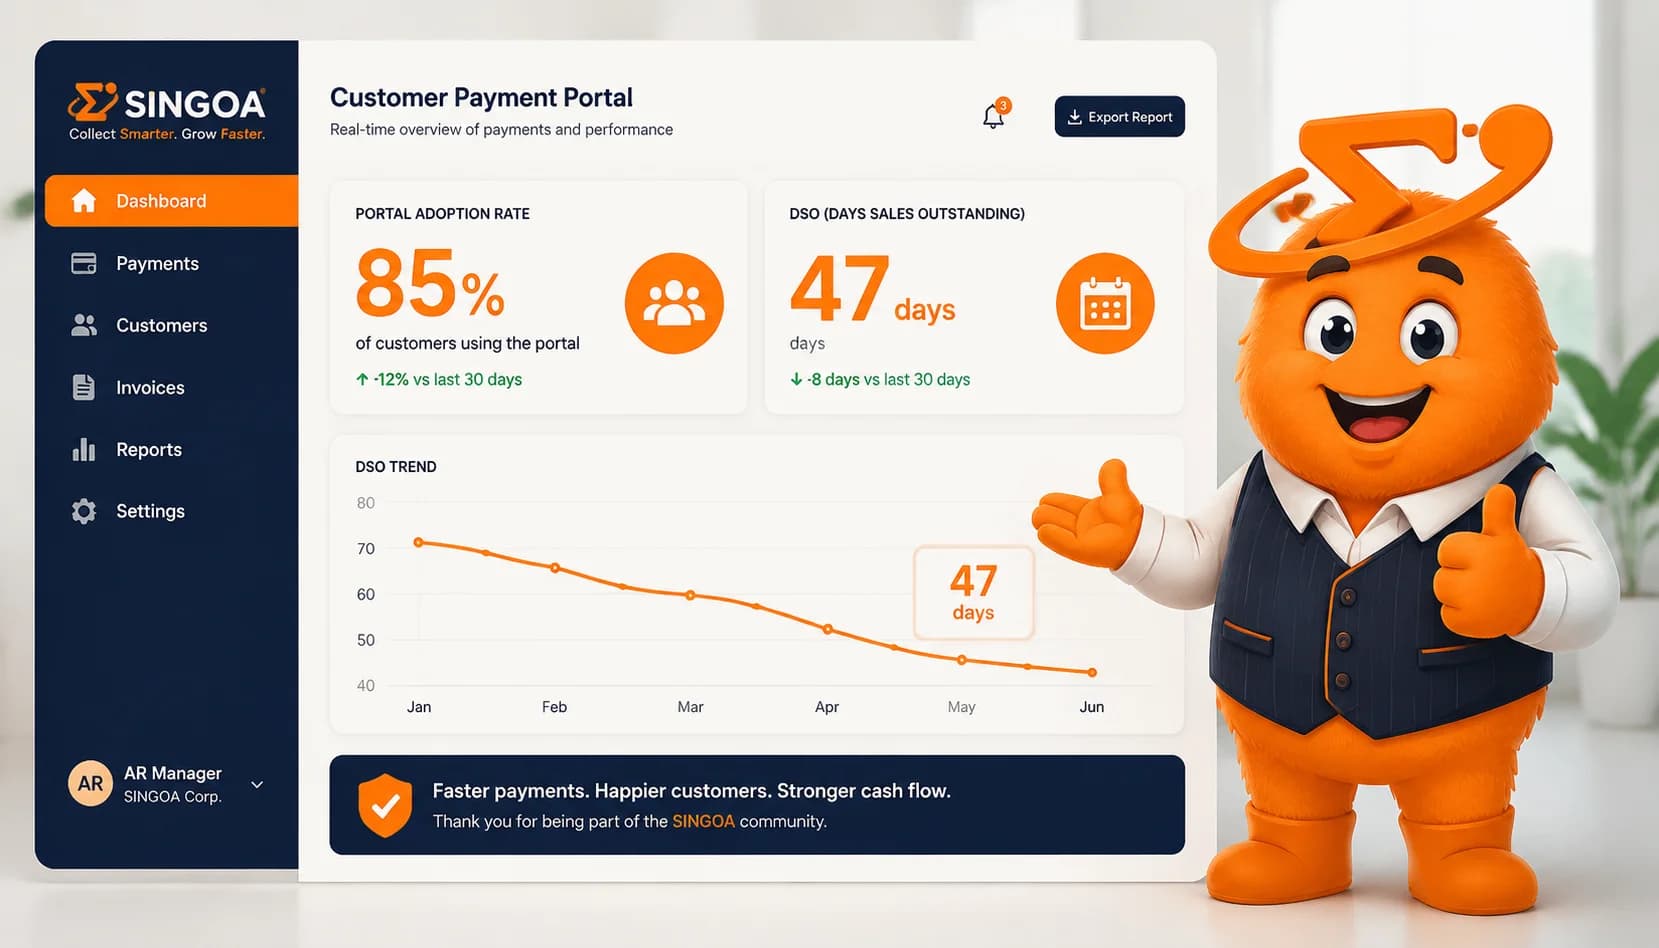
- Crossing 60% portal adoption typically reduces DSO by 12-18 days and deflects 40-60% of payment-status calls from the AR queue.
- Measure portal success by the share of invoices paid through the portal, not by login counts; login metrics flatter the dashboard without moving DSO.
See what 85% portal adoption is worth to your AR team
Plug in your monthly invoice volume to estimate the DSO days and AR hours you'd recover by moving from 25% to 85% portal adoption.
What a customer payment portal is (and what 85% adoption actually means)
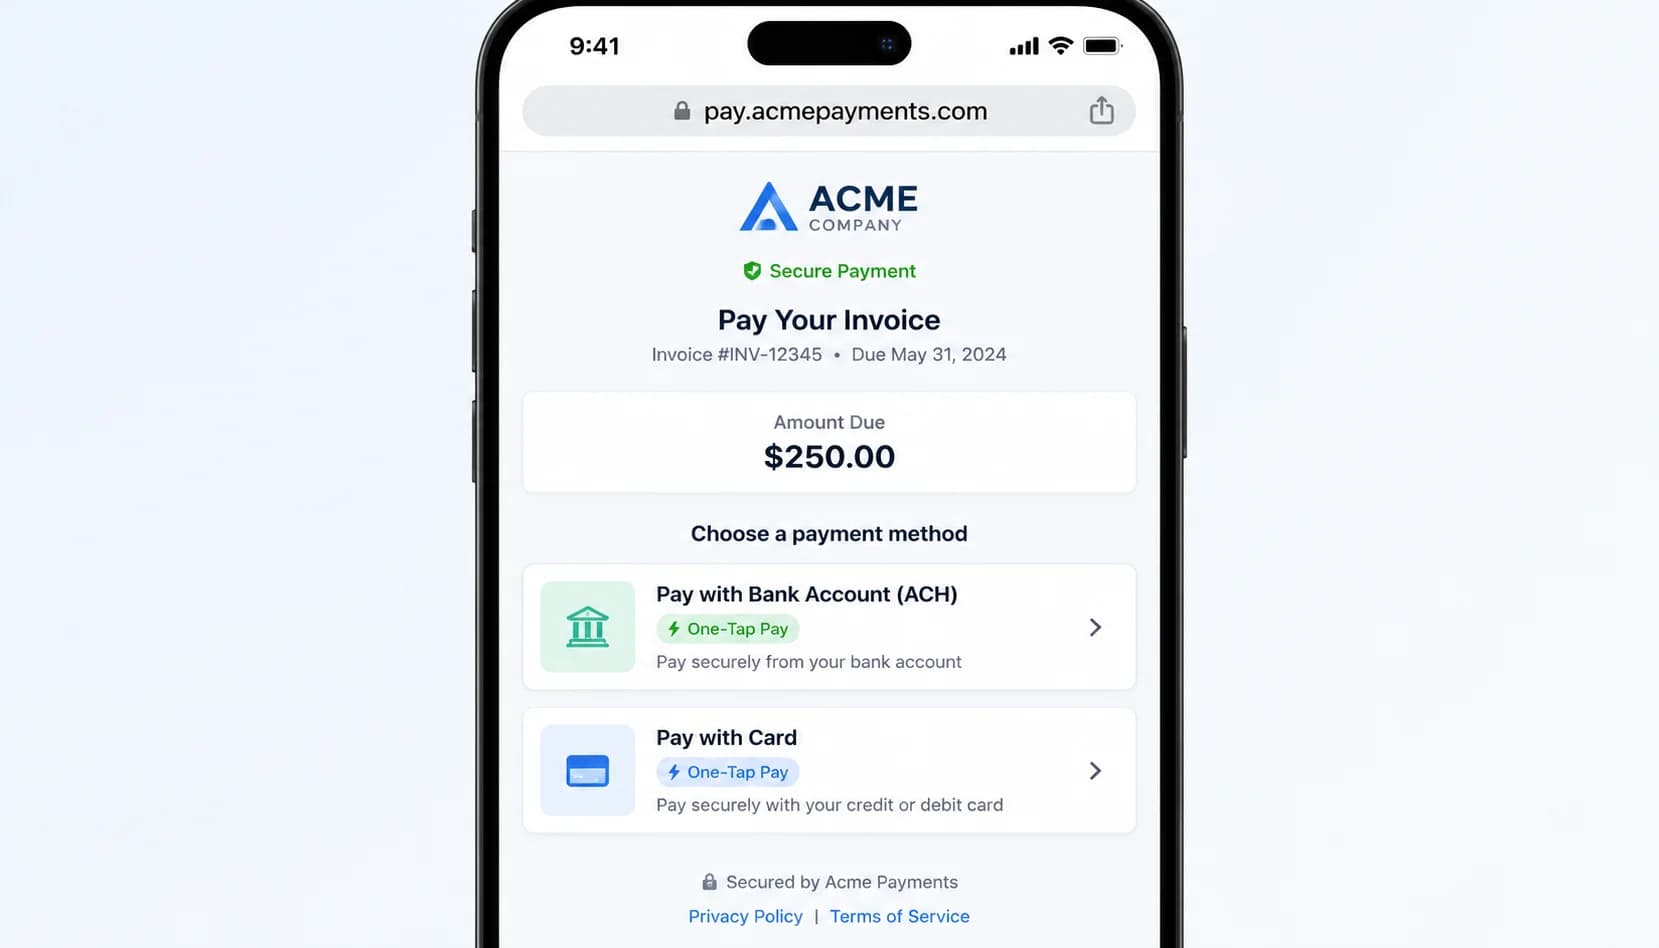
A modern B2B payment portal does three things at once. It shows the buyer every open invoice with line-item detail, it accepts payment by whichever method matches the buyer's AP workflow, and it stores a self-service history so finance can pull a remittance copy at 9 PM on a Thursday without calling anyone. Compare that to the typical legacy flow: a PDF invoice attached to email, a check mailed two weeks later, and a remittance spreadsheet that gets reconciled by hand the next month.
Adoption is the metric that matters, and it is widely misreported. Login counts inflate the picture because a buyer can log in and not pay. The honest definition is the share of active paying customers who actually settle at least one invoice through the portal in a given quarter. That number lines up with cash, AR aging, and the dunning calendar. If you want the broader operational frame, our [complete guide to AR automation](/blog/complete-guide-ar-automation) covers how portal usage threads into cash application and collections workflows.
Benchmarks tell a sobering story. Resolve Pay's 2024 study of B2B portal deployments found the industry average sits at 20-30%, while the top decile hits 81%. That puts most mid-market AR teams two-thirds of the way from where they are to where the best teams operate. The 85% target this post sets is not aspirational fiction. It is a documented ceiling that real teams already clear. The question is which levers got them there. Here is where it gets interesting.
Why portal adoption matters: DSO, cash-app accuracy, and team capacity
DSO is the headline number, and the math behind the 12-18 day improvement is straightforward (Ardent Partners, 2024). When a buyer pays through a branded portal, the funds clear faster than a mailed check, the remittance ties cleanly to one or more invoice IDs, and the AR team skips a follow-up cycle. PYMNTS Intelligence found that omnichannel B2B collection setups settle 25% faster than single-channel equivalents. Multiply that across 1,000 invoices a month, and you recover roughly two weeks of working capital. For the deeper playbook, see our piece on [DSO reduction strategies](/blog/reduce-dso-proven-strategies-2026).
Cash-application accuracy is the quieter win. Portal payments arrive with the invoice IDs already attached, so the match rate climbs into the high 90s without analyst intervention. Compare that to ACH-by-email payments, where remittance lives in a separate PDF that someone has to open, parse, and key in. PwC reported in 2023 that finance teams spend roughly 42% of their time on manual data processing. A portal payment removes that step entirely, freeing two to three FTE-equivalent hours per week on a 500-invoice book.
Call deflection is the third lever, and the one your team will feel inside 30 days. AR managers consistently report 40-60% drops in payment-status calls after portal adoption crosses the 60% mark. Buyers who can self-serve a remittance copy at 8 PM stop calling at 10 AM the next morning. The combined effect is real capacity: faster cash, cleaner books, and a team that finally has time for dispute resolution and credit work. But there is a catch, and it starts with branding.
Pro Tip
Don't measure portal success by logins. Measure by the share of invoices paid through the portal, that's the metric that ties directly to DSO and cash-application lift, and the one that survives scrutiny from a skeptical CFO.
Launch a white-label payment portal in days, not quarters
SINGOA's branded payment portal ships with custom subdomain, your logo, ACH + card + virtual card + wire support, and no-login pay links, all built in.
Layer 1: Branding, why a vendor-branded portal quietly tanks trust
The trust gap is the most under-discussed lever in the entire adoption playbook. A buyer at a $30M wholesale distributor receives an invoice from Acme Supply, clicks the pay link, and lands on portal.somevendor.com with an unfamiliar logo and a slightly different shade of blue. Forrester's B2B buyer research consistently shows that brand consistency drives a measurable lift in purchase confidence, often 30% or more. In an AR context, that confidence translates directly into willingness to enter bank account numbers and authorize a debit.
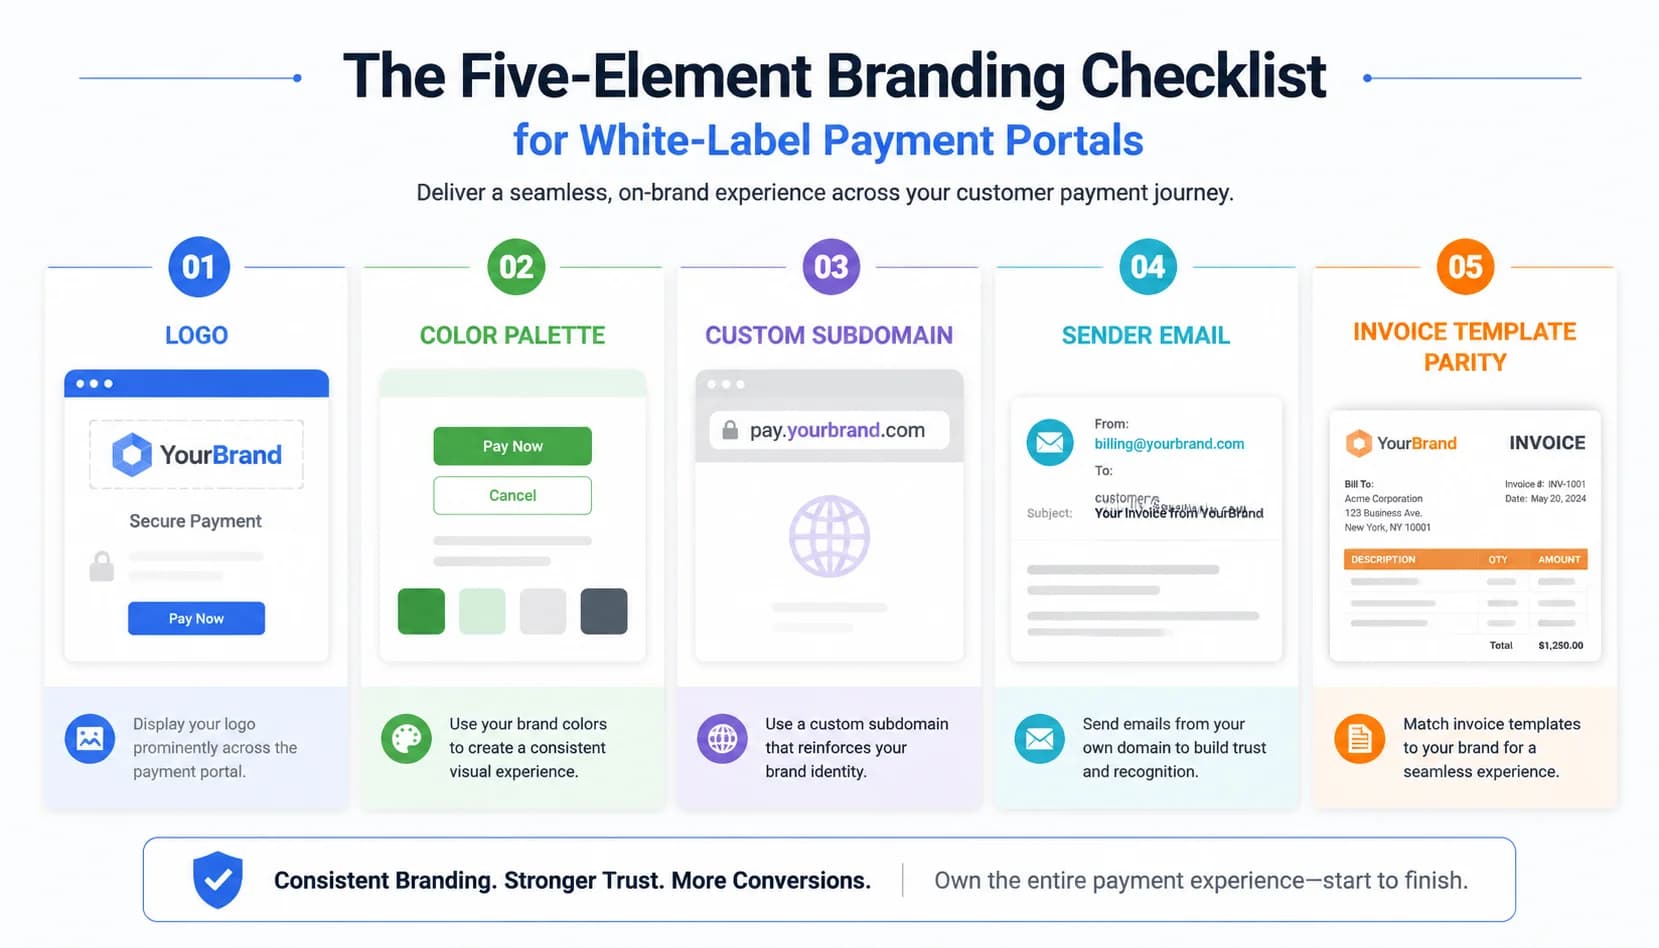
Five branding elements matter, and they stack. The logo and color palette are table stakes. The custom subdomain (pay.acmesupply.com instead of portal.vendor.com) is where most teams quietly leak adoption. The sender email address on every invoice and reminder needs to match the seller's domain (billing@acmesupply.com), not a vendor relay. And invoice-template parity is the final piece: the PDF the buyer sees inside the portal should match the PDF that comes attached to the email. Platforms like SINGOA's [branded payment portal](/features) ship with all five elements configurable out of the box.
Hosted versus white-label is a real choice with real tradeoffs. A hosted portal is faster to deploy, often inside a week, but it caps your adoption ceiling because the URL and sender domain stay vendor-branded. A white-label portal takes a few extra days to configure DNS and email authentication (SPF, DKIM, DMARC), and the payoff is the 10-15 point adoption lift that lets a mid-market team clear the 70% threshold. For most controllers, that math is obvious. The catch is execution. Each of the five branding elements has to ship, not just be theoretically supported. What most teams miss: branding alone gets you partway. The next layer is where adoption compounds.
Pro Tip
If your portal URL is portal.[vendor].com instead of pay.[yourcompany].com, you are leaking adoption. The custom subdomain alone typically lifts first-time-use rates 10-15 points within the first 60 days of cutover.
Layer 2: Frictionless UX, kill the login, embrace the methods
The login wall is the single biggest preventable adoption killer. A buyer clicks the pay-now button in an invoice email, lands on a login screen, cannot remember the password, gives up, and reverts to mailing a check. Tokenized pay links solve this in one stroke. Each invoice email and reminder carries a unique URL signed with a short-lived token. The buyer clicks once, lands on a pre-populated payment screen, and chooses a method. No password reset, no MFA prompt, no support ticket. Adoption typically jumps 15-20 points in the first 60 days after this change ships.
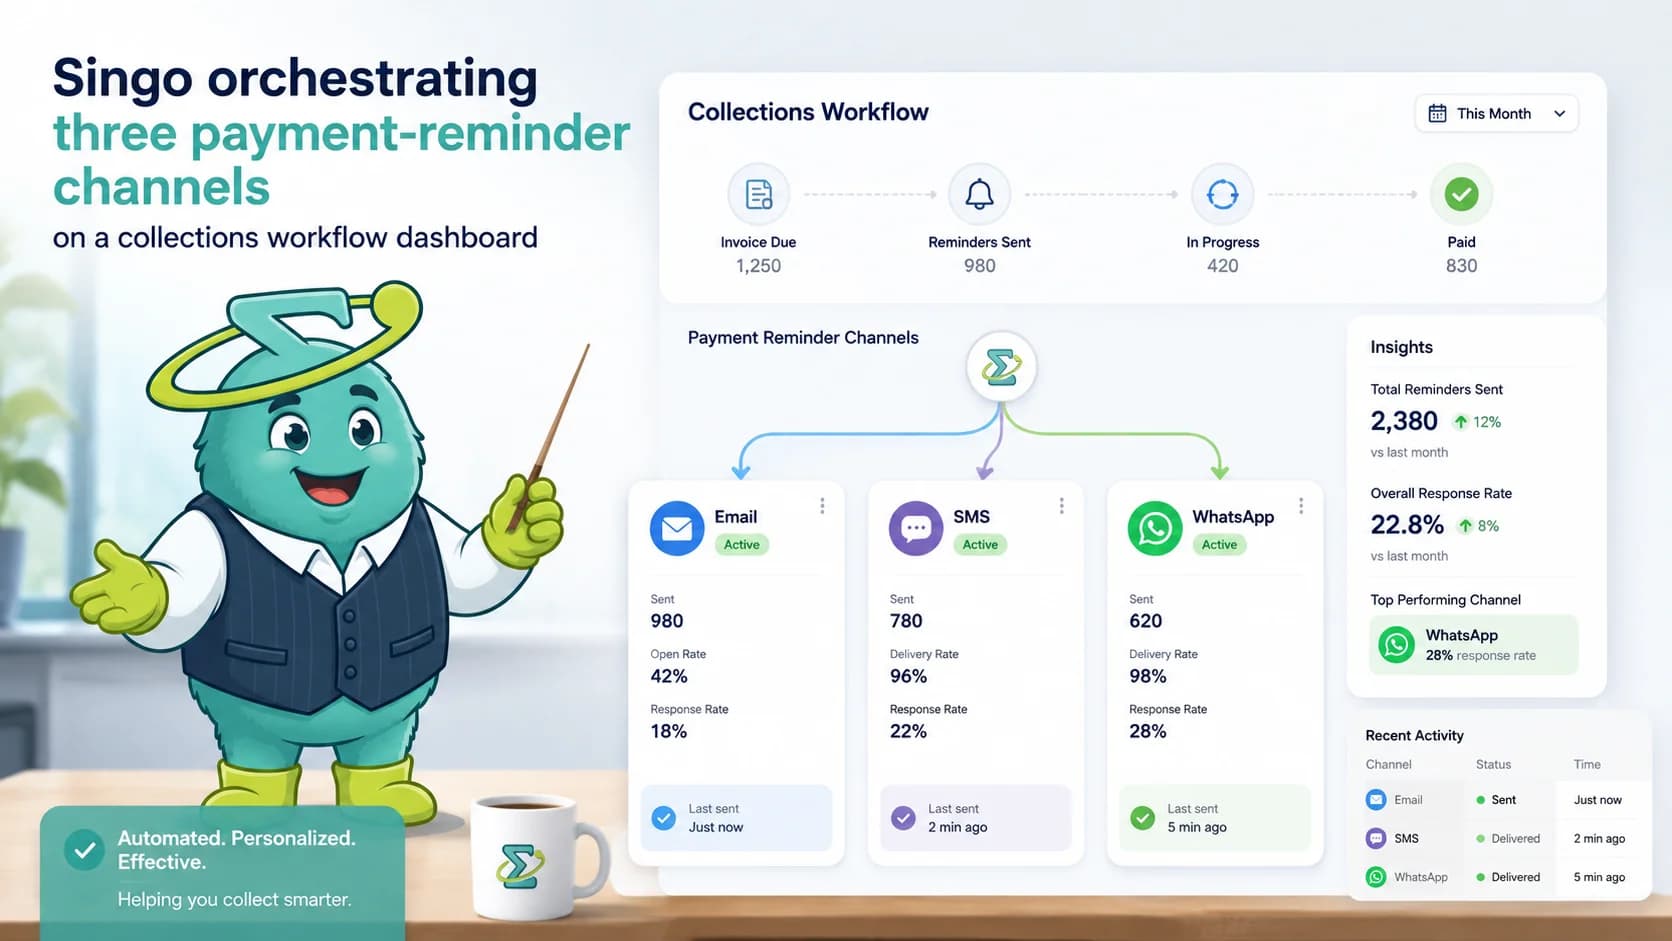
Payment-method coverage is the second lever. A portal that only supports ACH will lose every buyer whose AP team uses virtual cards for rebate capture. A portal that only supports cards will lose every buyer whose finance policy caps card payments at $5,000. Real coverage means ACH, credit card, virtual card, wire, and check-by-mail tracking inside the same UI. Each method routes to the appropriate rail behind the scenes, and the buyer never has to leave the portal to settle an invoice. The same logic applies across channels; our piece on [email vs SMS vs WhatsApp payment reminders](/blog/email-vs-sms-vs-whatsapp-payment-reminders) covers how to thread these links into multi-channel dunning.
Mobile-first is no longer optional. PYMNTS reported in 2024 that 38% of B2B AP staff initiate at least some payments from a phone, particularly in field-services and distribution verticals where the AP approver is rarely at a desk. A responsive layout with large tap targets, a single-column form, and Apple Pay or Google Pay for cards turns the phone into a legitimate payment terminal. Saved-payment-method support and autopay options finish the picture for repeat buyers. The real question is not whether your portal supports these features, but whether they ship enabled. The third layer takes adoption from strong to best-in-class.
Layer 3: Embedded distribution, the pay-now button is the portal
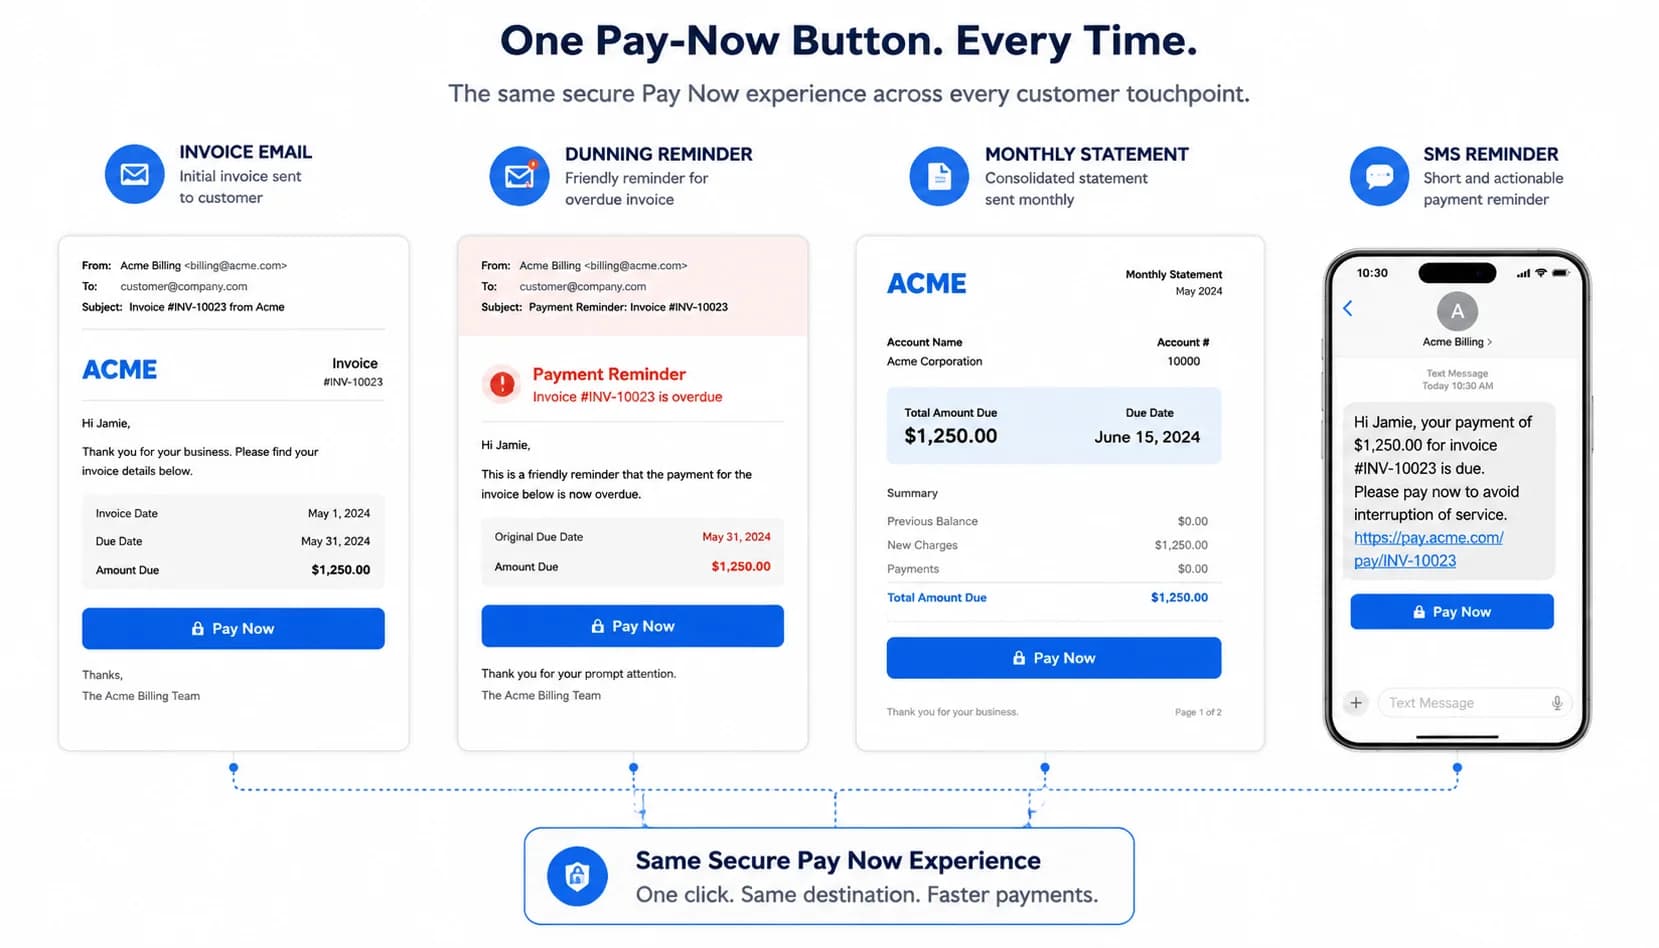
Distribution is the layer most teams under-invest in, and it is the cheapest to fix. The mental model that wins: the pay-now button is the portal. Every artifact a buyer touches between invoice creation and final payment should carry a one-tap link to the tokenized payment screen. That includes the original invoice PDF, the invoice email body, every dunning reminder regardless of channel, the monthly statement, and any ad-hoc collections outreach the AR team sends manually. Versapay's adoption research highlights this multi-surface placement as the single highest-leverage tactic for moving from 40% to 70%+.
Channel breadth matters more than channel volume. The same pay-now button needs to surface in email, SMS, WhatsApp, and on paper. For paper, a QR code linked to the tokenized URL turns a printed invoice into a tappable payment trigger. For field-services and trades verticals, that QR matters more than the email button because the AP signer may be a foreman approving the invoice on a phone at a job site. A portal that only lives on the web cedes those payments to the check pile.
Internal teams matter too. Every AR analyst's email signature should carry the pay-now link for any account they correspond with, and the dispute-resolution workflow should surface a pay-now button the moment a dispute is resolved. That last touch alone can recover 5-10% of disputed invoices that would otherwise age into late-late buckets. For the broader operational frame on running this without growing headcount, see our piece on how to [scale AR ops without adding headcount](/blog/scale-ar-operations-without-adding-headcount). Now to the checklist that ties all three layers together.
The 85% adoption checklist: a 14-step launch (or relaunch) sequence
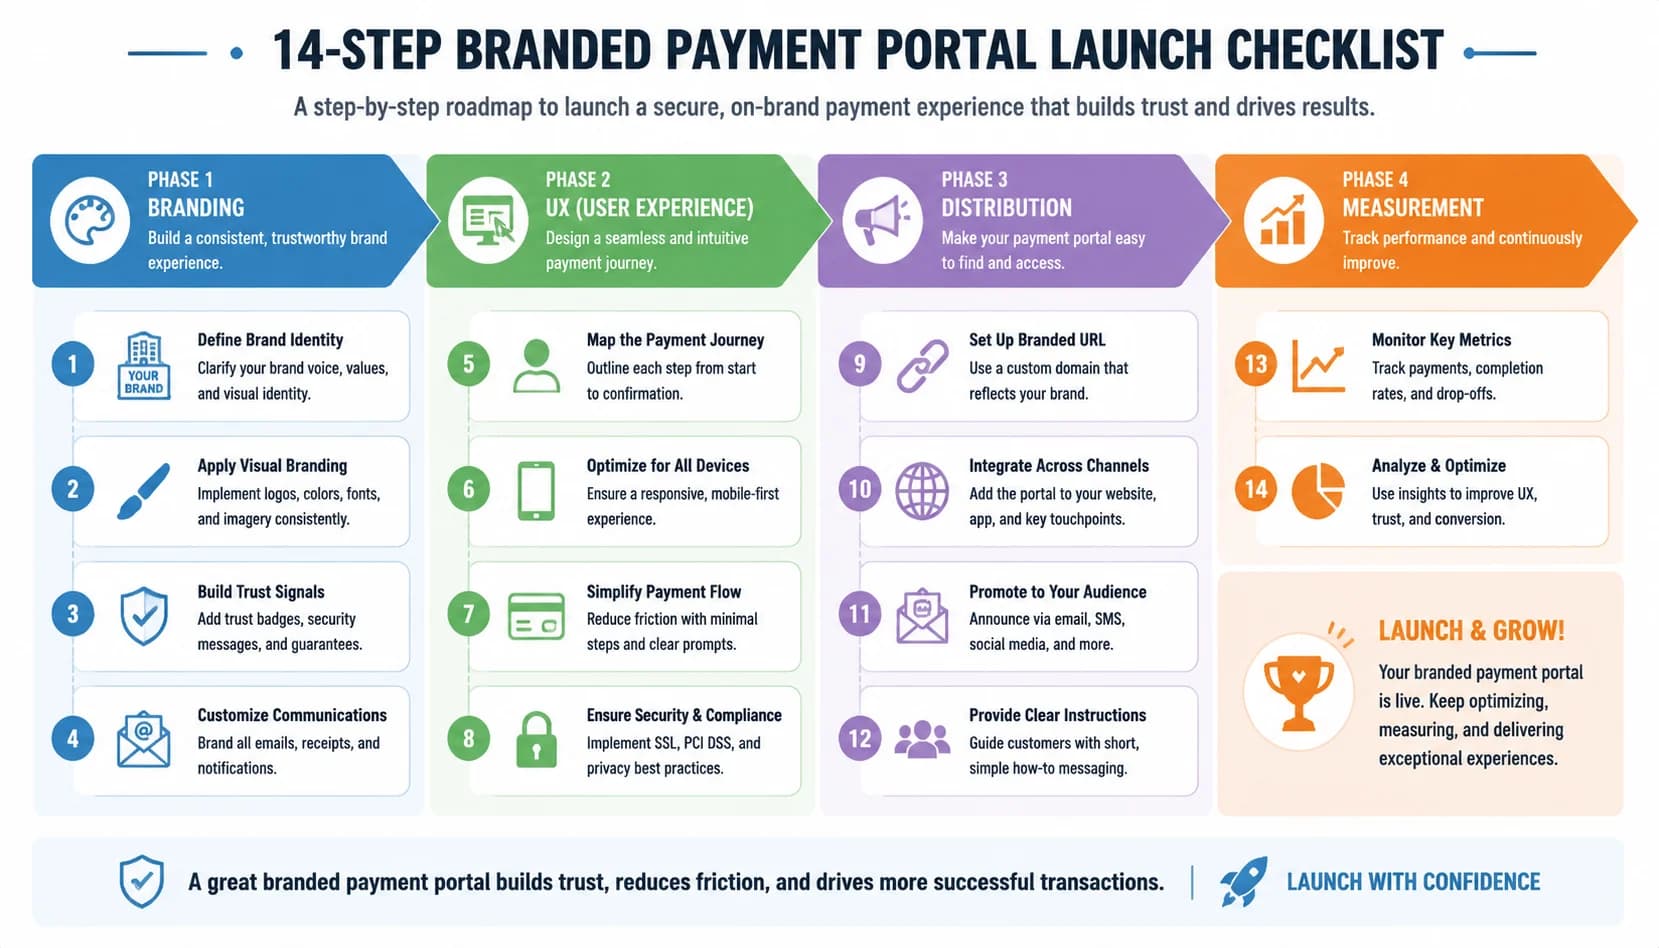
Phase 1 is branding, five steps in roughly five business days. Step one: configure the custom subdomain (pay.[yourcompany].com) with a CNAME entry pointing to the portal host. Step two: upload your logo and set the primary and accent colors to match your invoice template. Step three: authenticate the sender domain for email (SPF, DKIM, DMARC) so reminders ship from billing@[yourcompany].com instead of a vendor relay. Step four: align the in-portal invoice PDF with your existing invoice template. Step five: ship a soft launch to ten friendly accounts and collect feedback.
Phase 2 is UX, four steps. Step six: enable tokenized no-login pay links on every invoice email and reminder. Step seven: turn on the full payment-method matrix (ACH, credit card, virtual card, wire, and check tracking). Step eight: verify the mobile layout on iOS and Android with a real test invoice. Step nine: expose saved-card and autopay options for any buyer who has paid through the portal at least twice. Most teams finish phase 2 inside ten business days, and adoption typically jumps 15-20 points by the end of the second week.
Phase 3 is distribution, three steps. Step ten: embed the pay-now button in every invoice PDF and email template. Step eleven: add the same button to every dunning reminder, regardless of channel. Step twelve: include a QR code on printed invoices and statements. Finally, phase 4 is measurement: step thirteen tracks the share-of-invoices-paid-via-portal weekly, and step fourteen runs a monthly A/B test on reminder copy. Most teams clear 70% inside one quarter and 85% inside two. See [SINGOA pricing](/pricing) for the plan that includes the full white-label stack.
Pro Tip
Don't launch all 14 steps at once. Branding-first (5 steps), then UX (4 steps), then distribution (3 steps). Each phase compounds, and running them in parallel hides which lever actually moved the metric.
Common adoption killers and how to fix them fast
Killer one is the vendor-branded subdomain. A buyer hovers the pay link, sees portal.vendor.com, and pauses. Fix: configure a CNAME for pay.[yourcompany].com pointing at the portal host. Same-week implementation. Killer two is the mandatory login wall. Every required password reset is a tax on adoption, and most buyers refuse to pay it. Fix: enable tokenized no-login pay links on every invoice email and reminder. A short-lived signed URL preserves security while removing the friction.
Killer three is single-method coverage. A portal that only accepts cards turns away buyers whose AP policy caps card payments at $5,000 or $10,000. A portal that only accepts ACH loses buyers chasing card rebates. Fix: enable ACH, credit card, virtual card, and wire inside the same UI, then route each to the appropriate rail on the back end. Killer four is desktop-only design. PYMNTS reported 38% of B2B AP users initiate payments from phones. A non-responsive layout hands those payments back to the check pile. Fix: ship a responsive single-column mobile layout with large tap targets.
Killer five is reminders without pay-now buttons. Many AR teams send dunning emails that link back to the portal homepage rather than directly to a tokenized payment screen for the specific invoice. Fix: every reminder, regardless of channel, carries a one-tap pay-now button for the exact invoice referenced. Audit your current reminder templates this week. If any of these five killers are present, fixing them in order typically lifts adoption 20-30 points inside a quarter. That sets up the broader conclusion.
From 25% to 85%: the path forward
Eighty-five percent adoption is not a marketing number. It is what happens when an AR team stops treating the portal as a feature and starts treating it as the primary revenue channel. The teams that get there share a pattern: they ship branding first, UX second, distribution third, and they measure share-of-invoices-paid-via-portal weekly. They do not chase login counts. They do not bundle launches that hide which lever moved.
The math is honest. A jump from 25% to 85% adoption typically returns 12-18 DSO days, 40-60% of weekly status calls, and meaningful capacity for the AR team to focus on disputes, credit work, and customer relationships. For a mid-market business with $50M in receivables, that working-capital recovery alone often pays back the portal investment inside one quarter, before any cost-per-invoice savings get counted.
The 14-step checklist in this playbook is sequenced for a reason. Branding builds the trust that lets UX work. UX removes the friction that lets distribution work. Distribution puts the portal in front of every buyer at the moment they are thinking about payment. Run them in order and the adoption curve takes care of itself. Up next is the path to actually launching, which is where the rubber meets the road.