
Quick Answer
Calculate DSO by dividing Accounts Receivable by Net Credit Sales and multiplying by days in the period (30 monthly, 90 quarterly, 365 annual). Mid-market benchmarks span 35 days (SaaS) to 83 days (Construction).
Key Takeaways
- Standard formula: DSO = (AR / Net Credit Sales) x Days. Use net credit sales, not total revenue, to avoid downward distortion.
- Three methods exist: simple, average AR, and countback. Use countback when monthly revenue grows over 20% YoY or sales are seasonal.
- Mid-market benchmarks run 35 days (SaaS) to 83 days (Construction); best-in-class is industry median minus 5 to 10 days.
- DSO Efficiency Ratio (DSO / Average Terms) is a fairer cross-industry signal; target between 1.0 and 1.1.
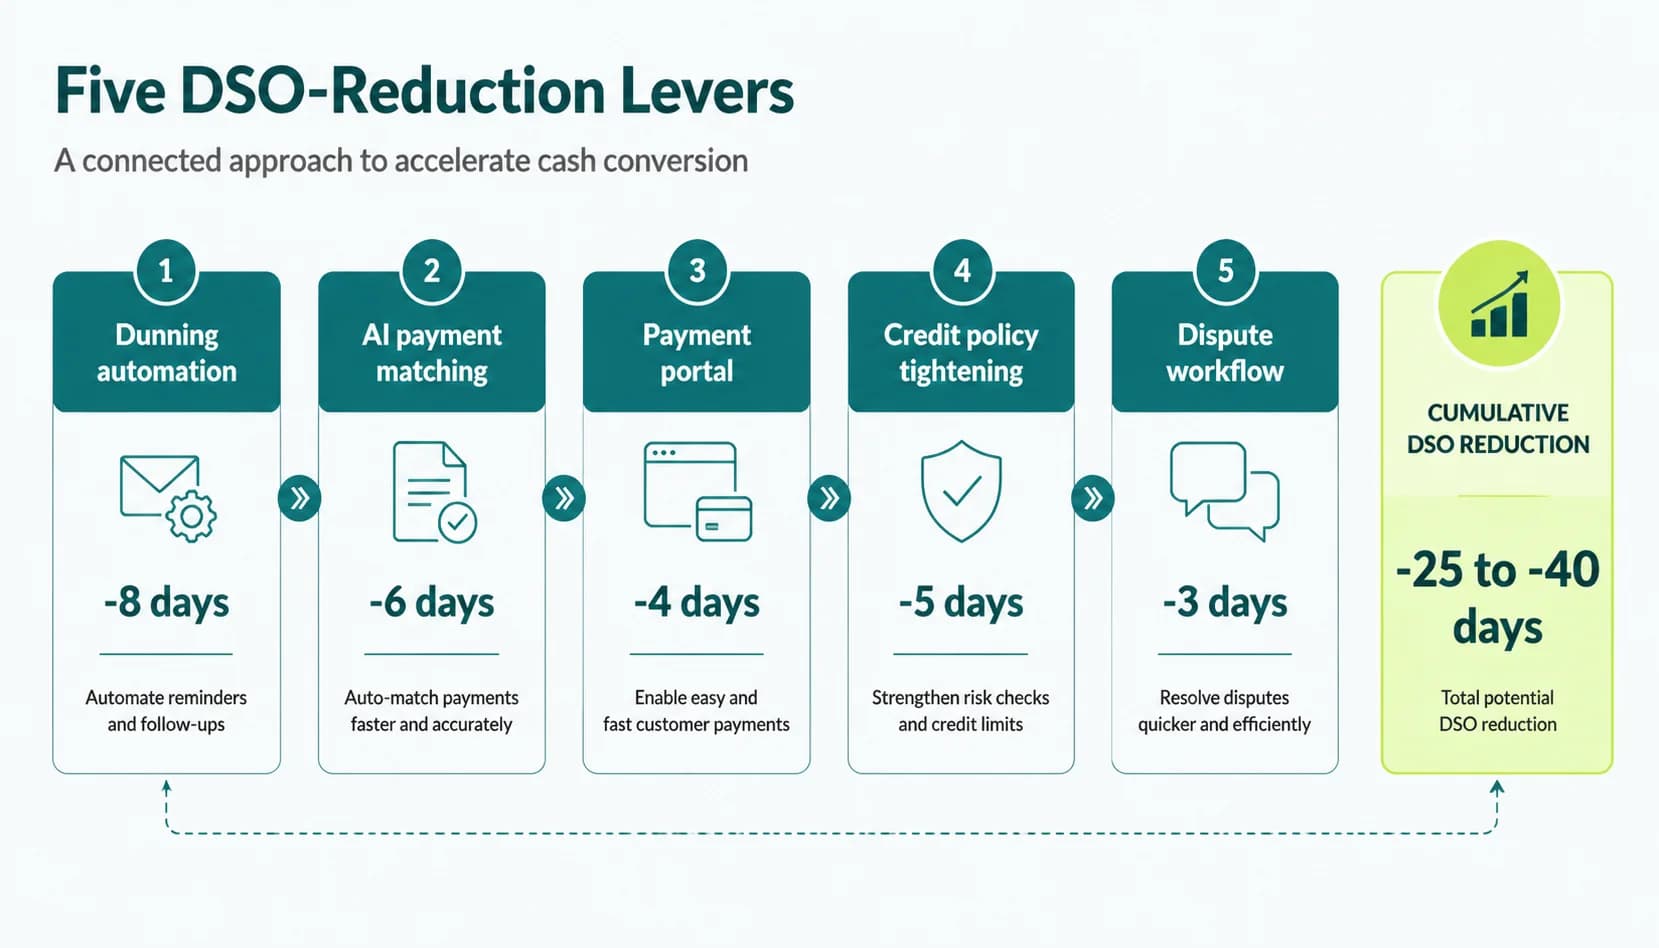
- Five levers cut DSO 25-40% in six months: automated dunning, AI payment matching, self-serve portals, tighter credit policy, and a dispute workflow.
See what cutting your DSO is worth
Plug in your monthly invoice volume and current DSO to see what a 25-40% reduction unlocks in working capital.
What DSO measures and why CFOs care
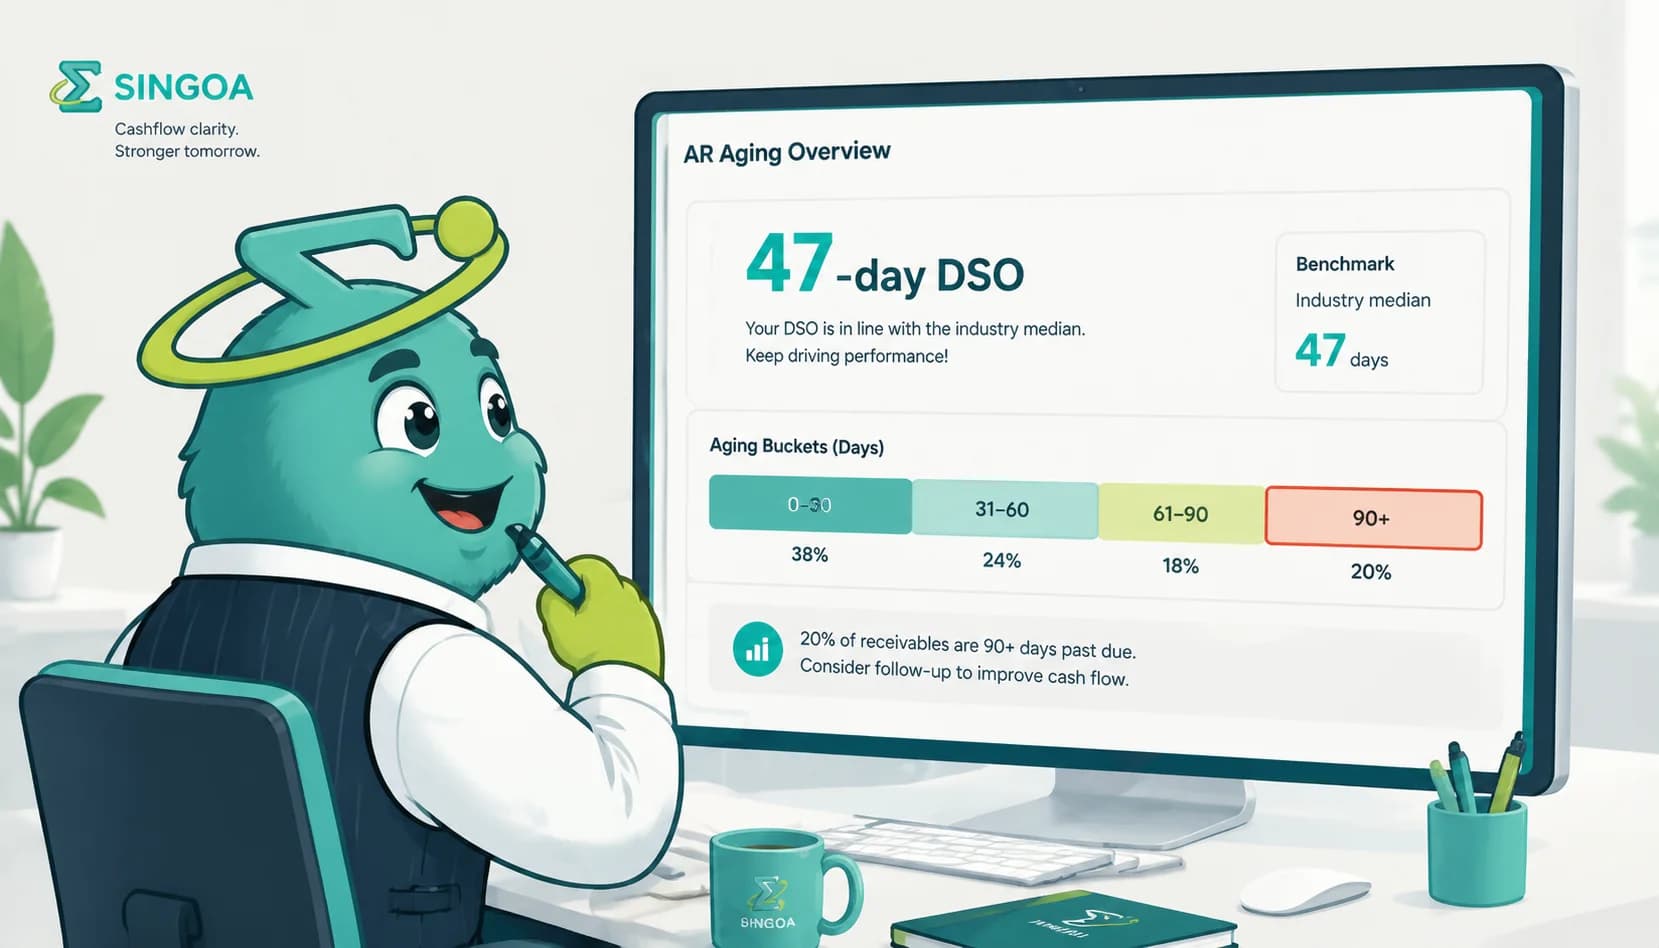
DSO is the headline KPI in any AR review for one reason: it converts a messy aging report into a single number a CFO can compare against last quarter, last year, or a benchmark. A 47-day DSO means the average invoice took 47 days to convert into cash. The metric is not perfect (we cover its blind spots in section 6), but no other single number captures collection efficiency as cleanly.
The working-capital math is what makes DSO board-level. On a $50M revenue base, every day of DSO equals about $137,000 of cash sitting in receivables. Cutting DSO from 55 to 45 days frees roughly $1.4M, cash that no longer has to be borrowed on a revolver at 8-10% interest. According to the 2024 PYMNTS B2B Working Capital Survey, 71% of mid-market CFOs now treat DSO as a primary liquidity input rather than a back-office accounting metric.
That promotion explains why your board pack increasingly asks for DSO monthly instead of quarterly, and why finance teams are expected to explain month-over-month moves of even two or three days. Before we get into the formula, it helps to know where DSO sits among the broader [AR KPIs every CFO should track](/blog/accounts-receivable-kpis-cfo-track), because reporting it in isolation tends to invite misleading conclusions. Here is where it gets interesting: most controllers learn the formula in five minutes, then spend years calculating it the wrong way.
- Define DSO in one sentence
- Working-capital framing: 1 day of DSO = ~0.27% of annual revenue locked in AR
- Why CFOs and boards request it monthly: cash conversion cycle, liquidity, forecast accuracy
The standard DSO formula (simple method)
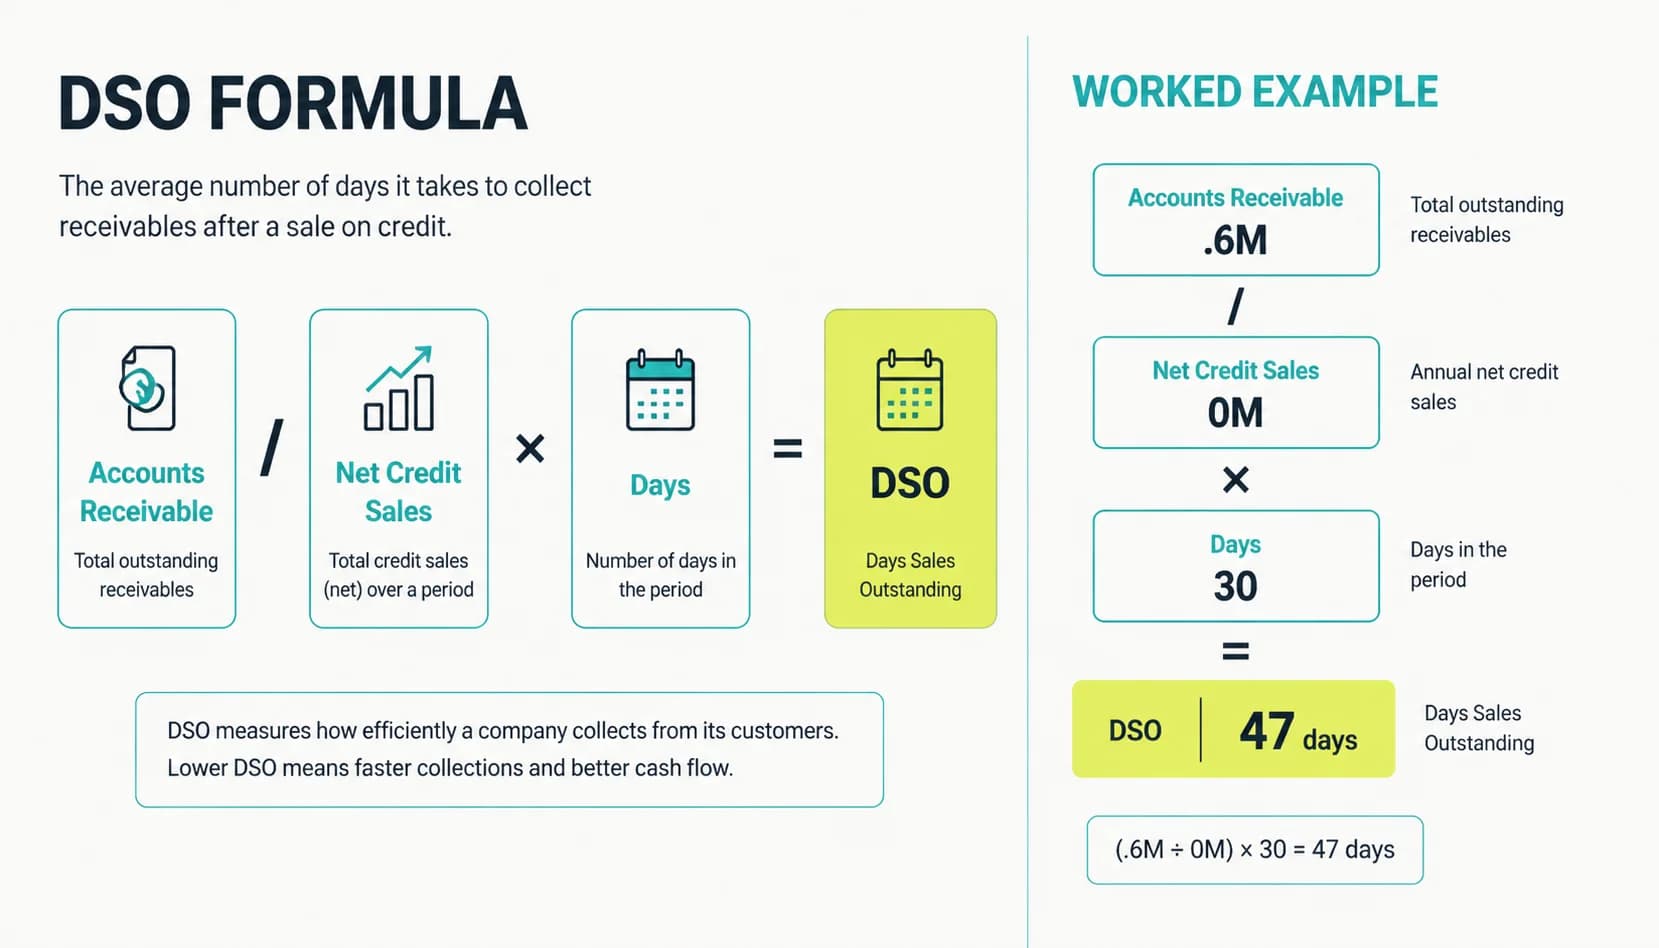
Plug in real numbers and the math is straightforward. A mid-market wholesaler with $4.2M in accounts receivable and $2.7M in net credit sales for the month would calculate ($4,200,000 / $2,700,000) x 30 = 46.7 days of DSO. That single number summarizes how long, on average, a dollar of credit sales sat as receivable before the customer paid.
The most common error is using total revenue instead of net credit sales. If 18% of your sales clear by credit card or upfront wire, including them in the denominator inflates sales relative to AR and pulls the DSO number down by several days. According to AccountingTools' DSO methodology, the resulting figure is not directly comparable to industry benchmarks, which are reported on a credit-sales basis. Strip cash sales out of the denominator before you reach for a calculator.
Period choice matters too. Monthly DSO (30 days) reacts quickly to billing or collection changes but bounces around with month-end timing. Quarterly DSO (90 days) smooths that noise but lags. Annual DSO (365 days) is the cleanest signal for board reporting but hides recent trends. Most mid-market finance teams report monthly DSO with a three-month rolling average alongside it, which is the cadence the controller can defend in a finance review.
- Display formula in a callout box
- Worked example: $1.2M AR / $4.5M monthly net credit sales x 30 = 8 days (then a more realistic mid-market example)
- Net credit sales vs total revenue, exclude cash sales to avoid downward distortion
- Monthly vs quarterly vs annual: choose the period that matches your reporting cadence
Cut DSO without hiring
Mid-market AR teams using SINGOA collect 35% faster on the same headcount. See how the five levers come together in one platform.
Two better methods: average AR and countback
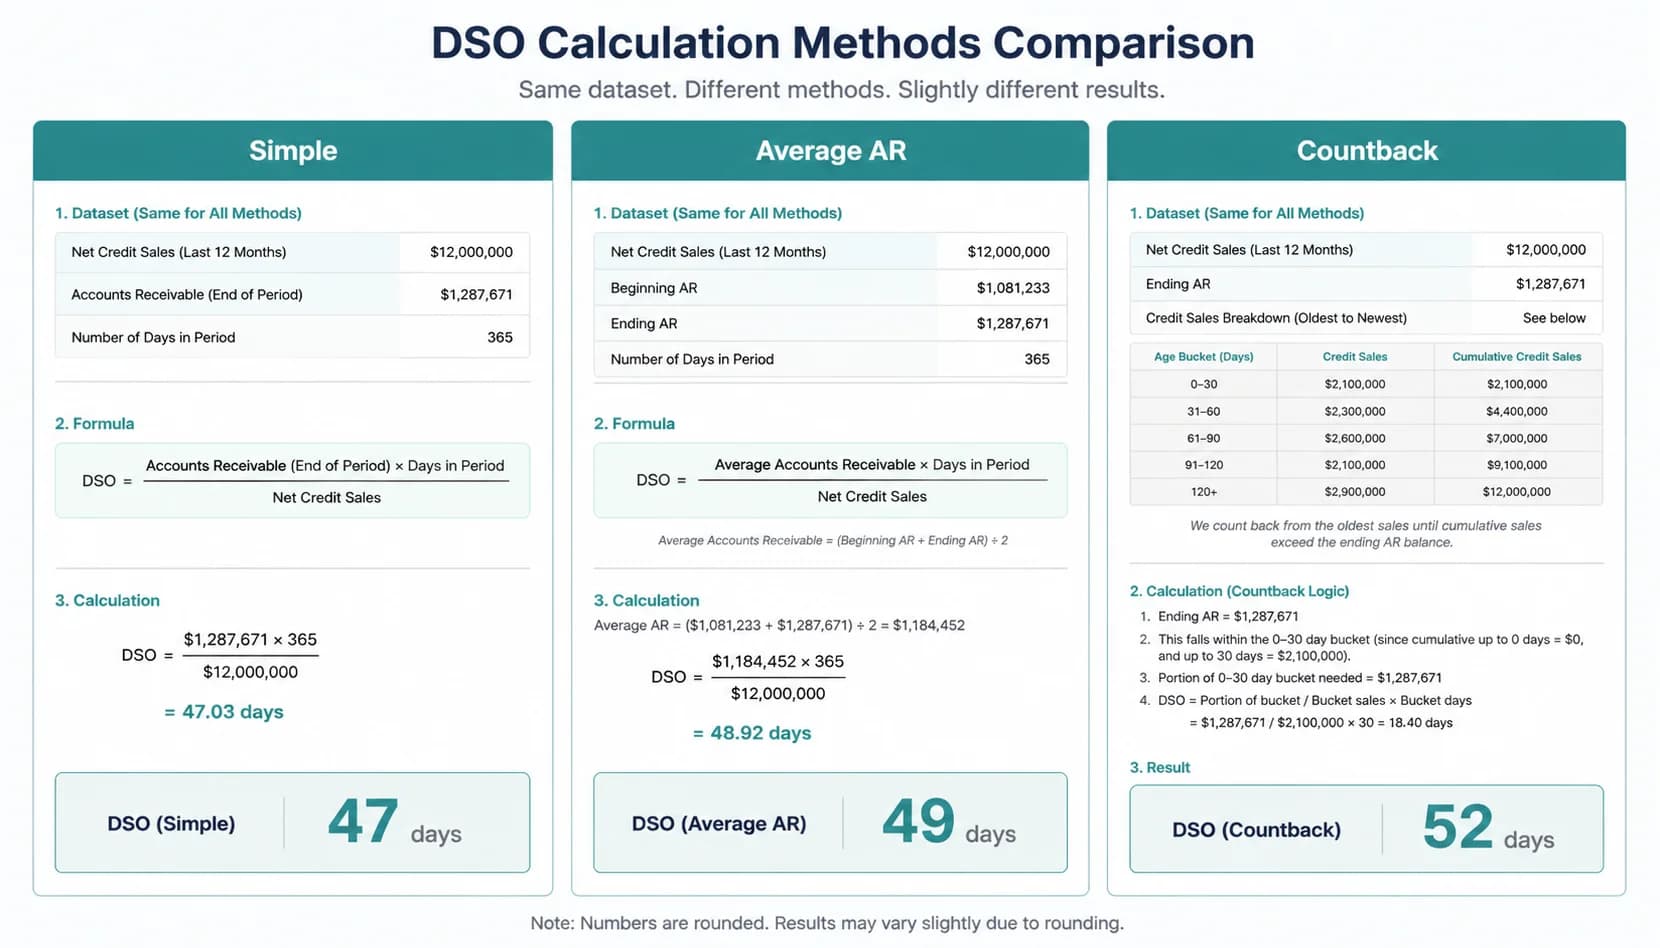
Average AR is a small but meaningful upgrade over the simple formula. Take a SaaS company with beginning AR of $1.8M, ending AR of $2.2M, and quarterly net credit sales of $5.0M. Average AR = $2.0M, so DSO = ($2,000,000 / $5,000,000) x 90 = 36 days. The same company using simple ending-period AR would report 40 days. The four-day swing comes entirely from how you handle a single month-end snapshot, which is why most external benchmarks publish on the average AR basis.
The countback method is the gold standard, and it is mandatory if your business is seasonal or growing fast. Walk backward from the AR balance through each month's net credit sales. If ending AR is $2.4M, this month's sales were $1.5M, and last month's were $1.0M, the AR clears 1.5 months of recent sales plus a fraction of the prior month: 30 + (0.9 / 1.0) x 30 = roughly 57 days. According to Upflow's three-method comparison, countback is the only method that produces a stable signal during seasonal swings or 30%+ revenue growth.
Which method belongs where? Steady-state businesses with flat monthly revenue can use simple. Companies with normal month-end timing variance should use average AR. Anyone seasonal, project-billed, or growing more than 20% year over year should use countback. The simple formula systematically understates DSO during growth because the denominator (recent sales) is inflated relative to the AR balance, which still reflects older, smaller-revenue months. The result: a worsening collections problem hides behind the growth story.
- Average AR formula and worked example
- Countback method walked through step-by-step on a 3-month seasonal example
- When each method is appropriate (steady state vs growth vs seasonal)
- Why simple DSO understates the metric for fast-growing companies (denominator inflation)
Pro Tip
If your monthly revenue grows over 20% year over year, the simple DSO formula systematically understates your true collection days. Switch to countback so you do not unknowingly hide a worsening collections problem behind growth.
DSO benchmarks by industry (mid-market, 2026)
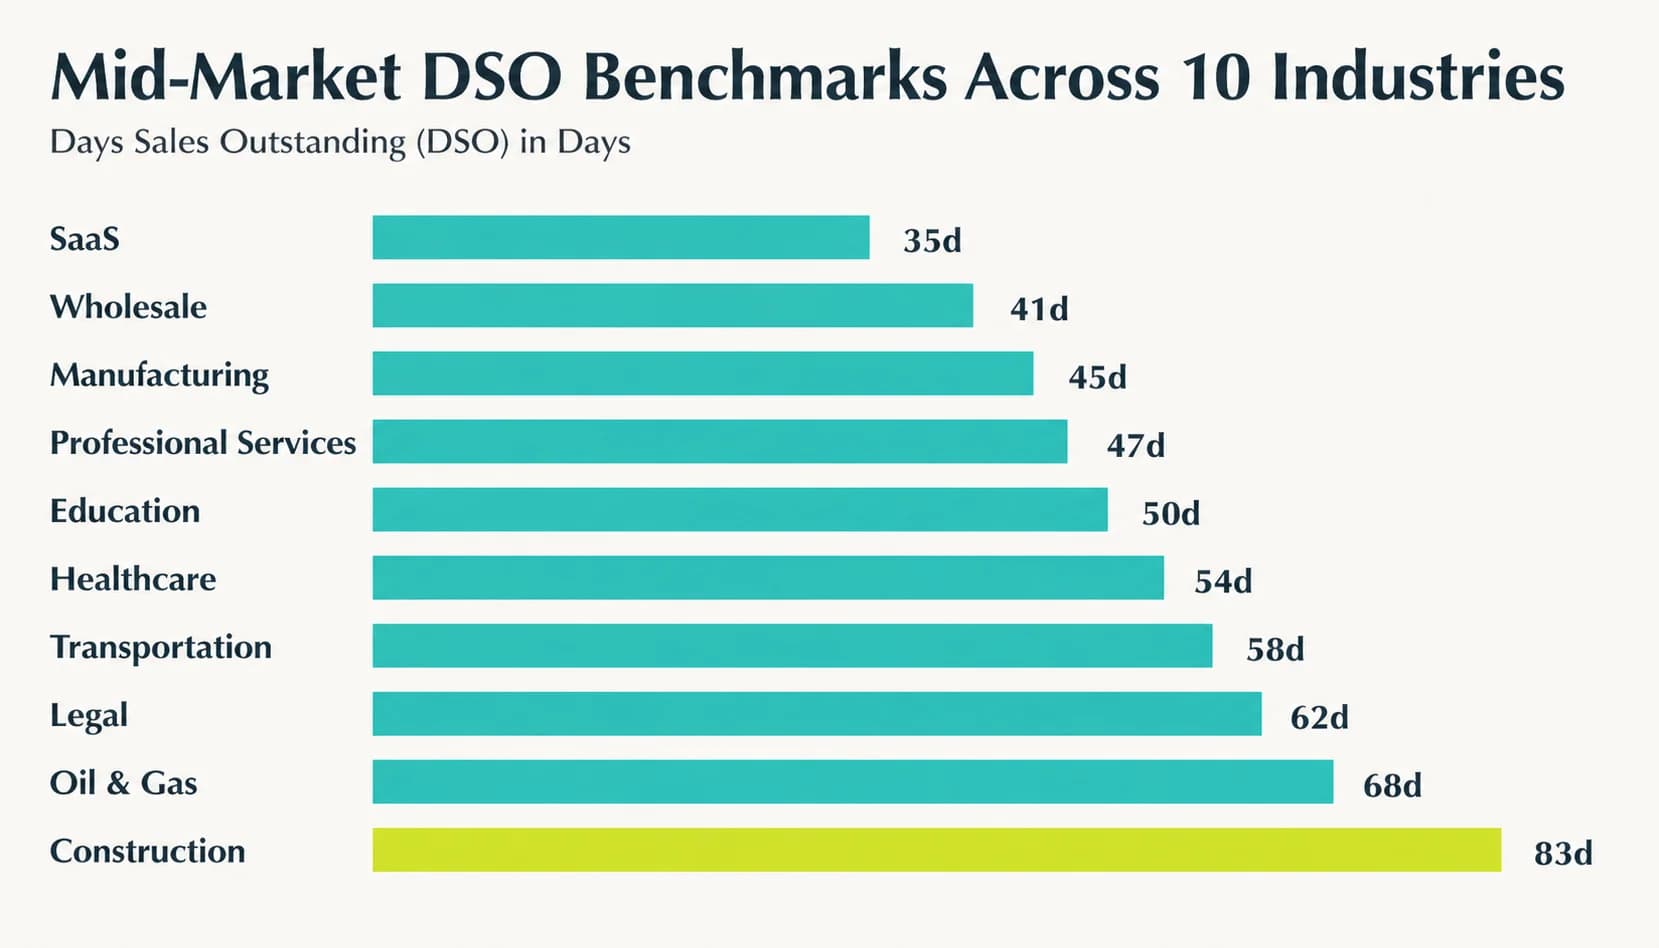
Here is the median mid-market DSO by industry, sourced from the 2024-2025 PYMNTS B2B Working Capital Survey, Creditpulse's 2025 DSO by Industry analysis, and Salesforce's revenue lifecycle benchmark guide: Construction 83 days, Oil and Gas 65 days, Manufacturing 58 days, Legal 55 days, Healthcare 52 days, Wholesale 48 days, Transportation 45 days, Professional Services 42 days, Education 38 days, SaaS 35 days. These are mid-market medians (companies between $5M and $500M in revenue), not enterprise figures.
Read the table in three layers. The median is your pass-fail line: above it, you are giving up working capital relative to peers. Best-in-class for your industry is the median minus about 10 days, which is the realistic stretch goal for a well-run AR team using modern tooling. Bottom-quartile sits at median plus 10 to 15 days and signals either chronic process gaps, a concentrated dispute backlog, or inadequate credit policy at onboarding.
Two industries deserve a footnote. Construction's 83-day median is structurally inflated by retainage (5-10% of contract value held back until project completion) and milestone billing tied to pay applications. Oil and Gas runs high for similar reasons: joint-interest billing and revenue accrual cycles tied to production statements. Comparing a construction firm's 75-day DSO to a SaaS company's 35-day DSO is not apples-to-apples, which is exactly why the DSO Efficiency Ratio in the next section is a fairer cross-industry signal.
One caveat on sourcing: industry benchmark numbers vary by 5-10 days between published reports because survey methodologies differ. Always cite the source year and report you used, especially in a board pack, so readers know which baseline you are comparing against. Now, the more useful question: what does your DSO mean once you adjust for your stated payment terms?
- 10-industry benchmark table: Construction 83, Oil & Gas 65, Manufacturing 58, Legal 55, Healthcare 52, Wholesale 48, Transportation 45, Professional Services 42, Education 38, SaaS 35
- Source attribution per row (PYMNTS, Creditpulse, Salesforce, AFP, Atradius)
- How to read the table: median vs best-in-class vs bottom-quartile
- Why construction and oil & gas DSO is structurally higher (retainage, milestone billing)
DSO Efficiency Ratio: a more honest performance signal
Two companies can both report 50-day DSO and have very different collection problems. If the first sells on Net 30, its efficiency ratio is 50 / 30 = 1.67, meaning customers pay 67% later than agreed. If the second sells on Net 45, its ratio is 50 / 45 = 1.11, which is essentially on-terms behavior. Same DSO, completely different collections health. That is the signal raw DSO misses.
The ratio is missing from 9 of 10 SERP results on this topic, which is a gift to controllers who want to look more sophisticated in front of a CFO. Calculate average payment terms as a weighted average across your top 80% of customers by revenue, then divide your DSO by that figure. A ratio of 1.0-1.1 is best-in-class collection behavior, 1.1-1.3 is normal mid-market drift, and over 1.3 means late-payment is the dominant story in your AR. Many of [the AR KPIs that actually drive cash flow](/blog/accounts-receivable-kpis-cfo-track) only make sense once you adjust for terms.
Pair the efficiency ratio with aging-bucket analysis. A 1.4 ratio with most lateness in the 30-60 bucket suggests dunning cadence is the problem. The same 1.4 with concentration in 90+ days points at disputes or write-off candidates. The ratio tells you the magnitude; the aging tells you the cause.
- Formula and example: DSO 50 / Net 30 terms = 1.67 (significant late-payment problem)
- Why this metric is missing from 9 of 10 SERP results, and why it matters
- Best-in-class efficiency ratio is 1.0-1.1; >1.3 indicates a structural collections problem
- Pair efficiency ratio with aging buckets to see whether late-payment is concentrated
Pro Tip
Report DSO Efficiency Ratio alongside raw DSO in your monthly board pack. It strips out the effect of stated terms changes and shows whether collections behavior is truly improving or just masked by extending Net 60 to Net 90.
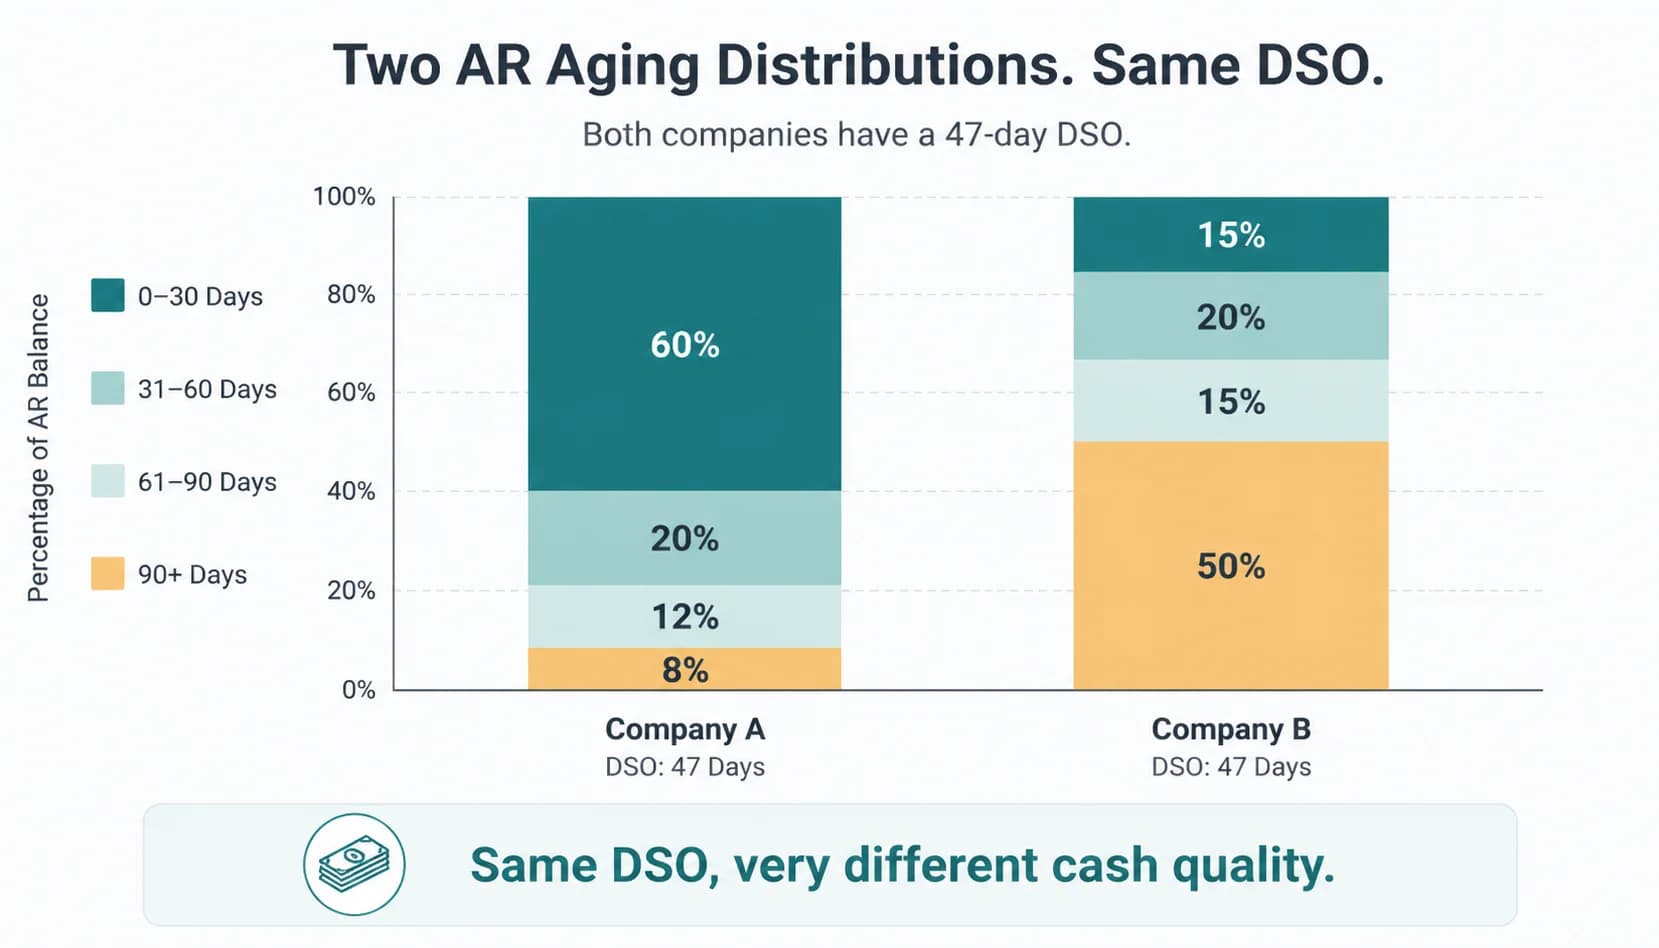
What DSO does NOT tell you (and how to compensate)
Two AR portfolios can produce identical 47-day DSO numbers and represent very different risk profiles. Portfolio A might have 92% of AR under 30 days and a small tail of stuck 90+ day invoices. Portfolio B might have most invoices clustered in the 45-60 day bucket with almost nothing aged out. Same average, very different collection problem. The first needs a focused workout on stuck accounts; the second needs to compress its mainstream cadence. DSO alone cannot distinguish them.
Customer concentration is the second blind spot. If your top three customers represent 40% of AR and one of them slips from Net 30 to Net 60 behavior, your portfolio DSO can move five days even though every other customer pays on time. Reporting a top-10 customer DSO alongside the portfolio number surfaces concentration risk before it becomes a covenant problem. Disputes are the third missing piece: a 90-day invoice held up by a billing error is not a collections issue, it is an operations issue, and dunning will not fix it.
The fix is a small companion dashboard. Beside DSO, report aging breakdown (current, 1-30, 31-60, 61-90, 90+), top-10 customer DSO, dispute rate as a percent of AR, and Best Possible DSO (AR if every customer paid exactly on terms). The whole package takes ten minutes a month to build and turns DSO from a vanity number into a decision-grade view. Now, what actually moves these numbers?
- DSO masks long-tail aging (a small number of 90+ day invoices can hide behind a healthy average)
- It does not capture customer concentration risk
- It does not separate late payments caused by disputes from late payments caused by inertia
- Companion metrics: Aging breakdown, Best Possible DSO, ADD (Average Days Delinquent)
Five levers that actually reduce DSO 25-40%
Lever one is automated dunning. Most mid-market teams send reminders sporadically because a human has to write them. A scheduled cadence (day 7, 14, 21, 30, 45) with escalating tone and the invoice attached typically removes 8-15 days of DSO on its own. The mechanism is simple: most late payments are administrative inertia, not refusal. A timely email reaches the right person before the invoice falls into a queue. Lever two is payment matching. Manual matching of bank deposits to invoices takes 3-5 days at most companies. AI payment matching using tools like SINGOA's payment-matching engine clears cash the same day funds arrive, which removes the 3-5 day delay between payment and AR closure.
Lever three is the customer-side payment portal. When you offer a portal where customers can view invoices, dispute lines, and pay by ACH or card, 20-30% will self-serve. That cohort moves into the on-time bucket without any collector touch, freeing your team to work the 70% who actually need a human nudge. Lever four is upstream: credit policy at onboarding. A short credit application, a structured limit assignment, and tiered terms (Net 15 for new customers, Net 30 after six on-time payments) prevent bad debt before it ages. According to the PYMNTS late-payment impact study, mid-market firms with documented credit policies carry 12 fewer days of DSO on average.
Lever five is the dispute workflow. Disputes are the number-one hidden DSO driver in B2B because a disputed invoice does not respond to dunning. Capturing disputes the moment a customer raises one, routing to the right internal owner, and tracking time-to-resolution typically moves another 5-8 days. Implemented together with the prior four levers, mid-market teams routinely see 25-40% DSO reductions in six months. For the full sequencing, see [the full DSO reduction playbook](/blog/reduce-dso-proven-strategies-2026).
- Lever 1: Automated dunning, typical 8-15 day DSO reduction
- Lever 2: AI payment matching, clears cash same-day vs 3-5 days manual
- Lever 3: Payment portal, 20-30% of customers self-serve when offered
- Lever 4: Credit policy + onboarding, prevents bad debt before it ages
- Lever 5: Dispute workflow, disputes are the #1 hidden DSO driver in B2B
How to set a DSO target your team can actually hit
Start with the industry median, not best-in-class. If you are a wholesaler at the median 48 days, a defensible 12-month target is 38-43 days. Going below 35 in year one usually means promising results that depend on operational changes you have not yet implemented. The second guardrail: cap your target at 1.2x your average payment terms. If you sell mostly Net 30, a target below 36 days is fighting the math of stated terms unless you also tighten terms.
A six-month staged roadmap beats a single annual number. Quarter one: instrument the dashboard, add automated dunning, fix obvious credit-policy gaps. Quarter two: deploy payment portal and dispute workflow. Each quarter sets an interim DSO target the team can show progress against in monthly reviews. Tie the target to a working-capital outcome, not just the metric: 'reduce DSO from 55 to 45 days, freeing $1.4M of working capital'. The dollar number is what gets executive attention.
Pair every DSO target with an aging-mix guardrail. A common failure mode: teams hit DSO targets by writing off stale 90+ day AR rather than collecting it. Add a second target like 'reduce 90+ day AR to under 5% of total' alongside the headline DSO number. To get there without growing your team, see how mid-market AR groups [scale AR without adding headcount](/blog/scale-ar-operations-without-adding-headcount).
- Anchor target to industry median, not best-in-class
- 6-month staged roadmap beats annual target (controllers can show monthly progress)
- Tie target to working-capital outcome, not just the number itself
- Review monthly, not quarterly
Pro Tip
Pair every DSO target with a complementary aging-mix target (e.g. 'reduce DSO to 42 days AND reduce 90+ day AR to under 5% of total'). Without the second guardrail, teams hit DSO targets by writing off old AR rather than actually collecting it.
The bottom line: turning DSO from formula to working capital
DSO is a five-second formula and a five-year discipline. Calculating it correctly (net credit sales in the denominator, the right method for your business, the right period for your reporting cadence) gets you a number you can defend in a finance review. Comparing that number to your industry median, then to your DSO Efficiency Ratio, gets you a story your CFO can act on. Skip either step and the metric becomes performance theater.
The tactical playbook is small. Pick the calculation method that matches your growth and seasonality profile. Anchor your target to the industry median minus 5-10 days, capped at 1.2x your stated terms. Build a six-month roadmap with quarterly milestones rather than a single annual number, and pair every DSO target with an aging-mix guardrail so the team cannot game the metric by writing off old AR. Track DSO Efficiency Ratio as the leading indicator each month.
The real prize is the working capital. For a typical mid-market firm, executing the five levers (automated dunning, AI payment matching, self-serve portal, credit policy, dispute workflow) frees seven figures of cash within six months without expanding headcount. That is the conversation your board actually wants to have, and the one a well-calculated DSO unlocks.


